Stock Market Current Trend and Turning Point
Stock-Markets / Financial Markets 2011 Jan 10, 2011 - 01:53 AM GMTBy: Andre_Gratian
 There is nothing complicated or confusing about the current market trend(s). Let's go directly to the SPX Daily Chart, and I'll show you why.
This is a linear chart, with only the closes and not the intra-day highs and lows, making it easier to see the trends. Note that the various trends are all confined to channels which are all labeled according to their time span.
The long-term bull market channel is colored in green, and is bisected by a dashed line which represents the channel mid-point. The index is currently trading in the top half of the channel, which is a sign of long-term strength.
The intermediate trend is colored in blue and is also bisected by a dashed line. The SPX is trading in the upper half of the channel, also a sign of strength.
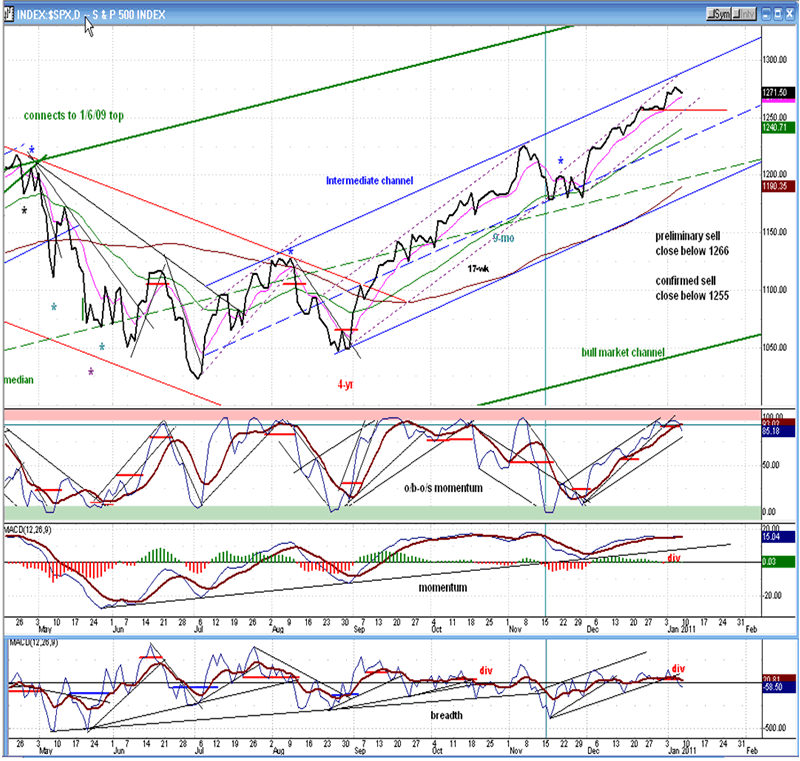
There are three short-term channels within the intermediate trend, and these are outlined in purple dots. We are currently trading at the top of the third of these channels, and appear to be very close to a reversal. This is best observed in the indicators.
The top indicator is overbought and just beginning to roll over, and the lower indicator shows that price is finding less and less support from the market breadth. This is a sign that the short-term trend is ready to come to an end and that a short-term correction could happen at any time. It is possible that this short-term reversal could turn out to be a consolidation prior to the continuation of the bull market trend.
I have made a notation of what daily closes would be required from the index to give a sell signal. So far, there is none and we have to keep in mind that the Point & Figure base count has a potential projection to 1312. Until there is a definite sell, the SPX can still move higher.
I have been aware for the past couple of weeks that we were getting close to a short-term top and, because there were some short-term cycles due to make their lows last week, I thought that there was a possibility that they might get something started on the downside. So far, it looks as if they have failed to cause an immediate reversal.
Let's take a look at the Hourly Chart and see why!
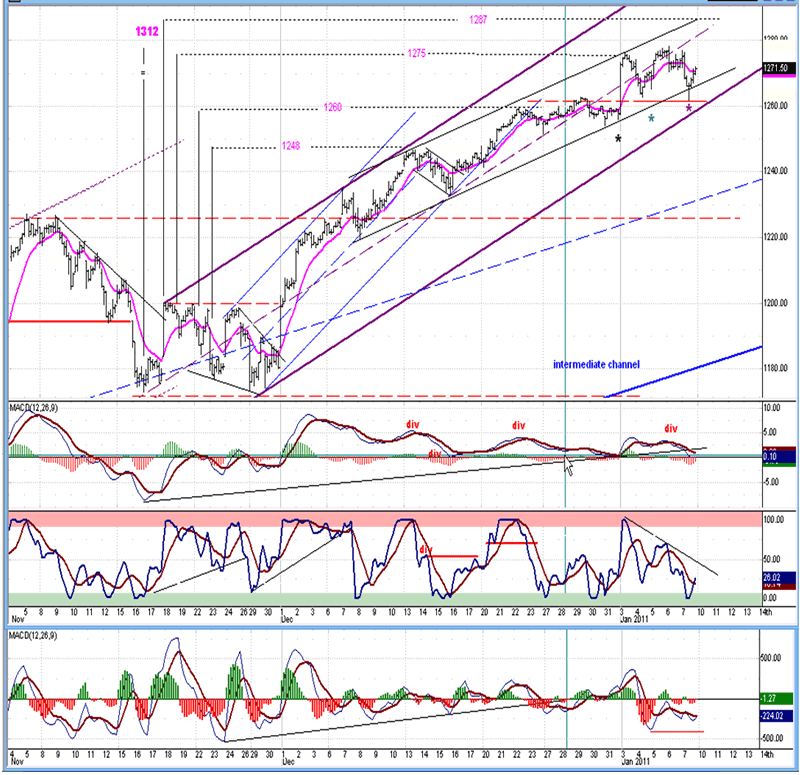
On this chart the emphasis in on the third short-term channel of the intermediate trend. I have replaced the dots by solid purple lines. Note that there is also another diagonal channel and that the bottom line supported prices on Friday. To give a sell signal, the index would have to drop outside of both channels.
I have included the projections from the various phases of the base pattern. These are derived from the P&F chart. After being reached, each phase projection was followed by a near-term consolidation before the index moved higher. The total base projection is 1312, but before the SPX gets there, it may pause at (or reverse from) the next interim target of 1287. A final high may even have made at the current level.
The asterisks indicate the short-term cycles which made their lows in the past few days. I had expected the first (black) one to bottom on January 3 or 4, but instead, it made its low on the 1st. This probably caused the combined effect of all the cycles to be more muted than it would have been otherwise.
Now let's analyze where we are. On Friday, the last bottoming cycle caused a 17-pt dip in the index, which was followed by a good recovery. Prices found support where they had before, and the 11-pt rally shows that there is still buying interest. This is one reason why we should not expect a reversal of the entire trend to start immediately. Another reason is the position of the indicators; they are at their lows and two have begun to turn up. Also, there is some positive divergence in the lower (A/D) one, and this could be significant.
Since all the cycles have now turned up, upside resistance should be minimal, but there could be a little consolidation before moving higher. In order to do so, 1278 will have to be exceeded. If the index fails to do this, the odds of a reversal from this level will become more likely.
Sentiment
Another reason why we may not yet be quite ready to reverse was the action of the VIX at the end of trading on Friday. Here is the chart:
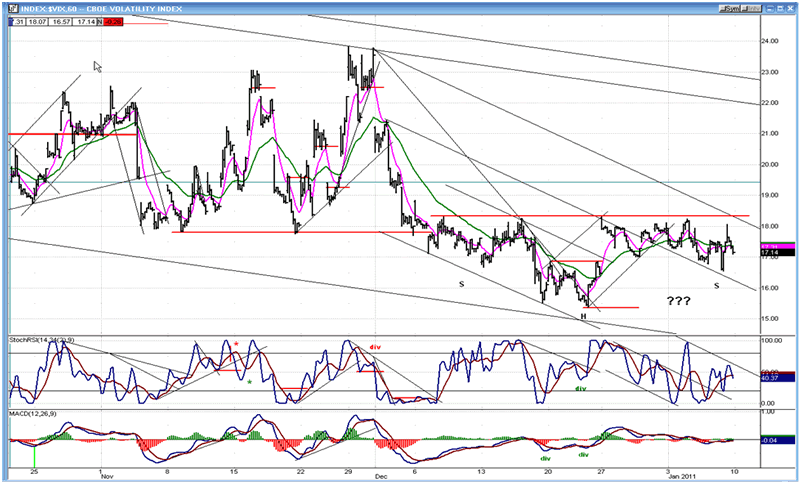
The fact that it sold off at the close suggests that it may not be ready to break out above its former resistance level (a little above 18.00) and, conversely, that the SPX is not ready to reverse. The bottoming action appears to be tracing out a head and shoulder pattern. If this is valid, the break-out could occur within a matter of hours. However, H&S patterns have a nasty habit of looking very good until they fall apart. Consequently, we need to see if this is, in fact, what the VIX is doing. If it keeps on moving lower, not only would it invalidate the pattern, but also warn us that the SPX wants to move higher.
Dollar
The VIX only mirrors the SPX: it does not influence it. The dollar, on the other hand, can have a strong influence on commodities such as oil, and this affects the SPX directly. It is not a coincidence that the index was not able to move higher in the past month. As you can see on the following chart, the dollar was in a strong short-term uptrend. As long as it continues, equity indices will be affected negatively and they will eventually reverse their trends.
The daily chart is on the left and the hourly chart on the right. There is no denying the strength of the dollar with the P&F chart giving it a projection of 83+ for the short-term. However, some negative divergence is appearing in the daily chart, and the hourly prices are forming a wedge pattern with the top indicator severely overbought and the lower one losing its upside momentum. This means that the dollar is probably nearing a near-term pause, and this would allow the indices the opportunity to continue their uptrends.
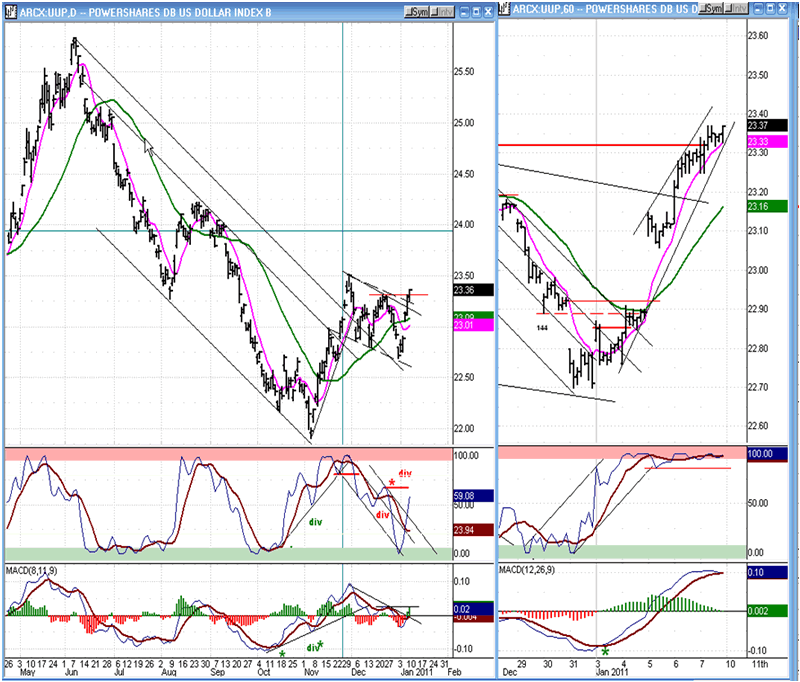
We will have to keep a close watch on the VIX, the dollar, and the SPX over the next few days to see if the index can squeeze a few extra points on the upside to meet its next projection.
Gold
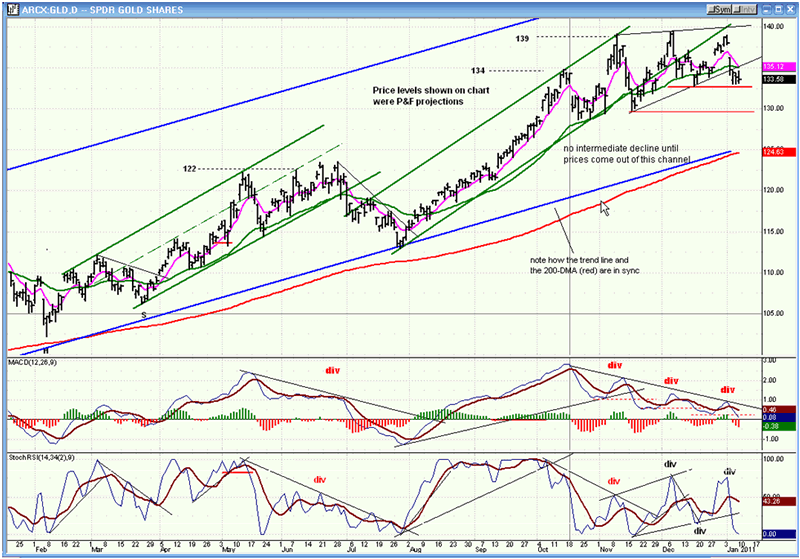
GLD has now formed a triple top at its 139 projection level. In the last newsletter, I mentioned that it looked as if the ETF was forming a terminal pattern in the trend which started at 114. The triple top reinforces this view. GLD has now moved completely out of its short-term (green) channel, and the last up-move looks like it was a back-test of the lower trend line.
Everything about the chart action and the indicators is negative, which signals that the ETF is more likely to continue its correction than to move higher. Already there is enough distribution on the P&F chart to send prices down to 121, and perhaps as low as 111. To confirm these targets, GLD would have to trade below 130. If it adds to the distribution before declining, the projections will be increased proportionally.
Since the strength in the dollar can have a strong reverse influence on gold, the odds are very high that GLD will start a significant decline if the dollar continues its uptrend.
Conclusions:
The SPX may be ready to start a short-term correction. In order to confirm this, it would have to close below 1266 on a daily basis, and then follow through by penetrating the 1255 level. Until this happens, the index could still move higher to reach its next projections.
FREE TRIAL SUBSCRIPTON
If precision in market timing for all time frames is something which is important to you, you should consider a trial subscription to my service. It is free, and you will have four weeks to evaluate its worth.
For a FREE 4-week trial. Send an email to: ajg@cybertrails.com
For further subscription options, payment plans, and for important general information, I encourage you to visit my website at www.marketurningpoints.com. It contains summaries of my background, my investment and trading strategies and my unique method of intra-day communication with Market Turning Points subscribers.
By Andre Gratian
MarketTurningPoints.com
A market advisory service should be evaluated on the basis of its forecasting accuracy and cost. At $25.00 per month, this service is probably the best all-around value. Two areas of analysis that are unmatched anywhere else -- cycles (from 2.5-wk to 18-years and longer) and accurate, coordinated Point & Figure and Fibonacci projections -- are combined with other methodologies to bring you weekly reports and frequent daily updates.
“By the Law of Periodical Repetition, everything which has happened once must happen again, and again, and again -- and not capriciously, but at regular periods, and each thing in its own period, not another’s, and each obeying its own law … The same Nature which delights in periodical repetition in the sky is the Nature which orders the affairs of the earth. Let us not underrate the value of that hint.” -- Mark Twain
You may also want to visit the Market Turning Points website to familiarize yourself with my philosophy and strategy.www.marketurningpoints.com
Disclaimer - The above comments about the financial markets are based purely on what I consider to be sound technical analysis principles uncompromised by fundamental considerations. They represent my own opinion and are not meant to be construed as trading or investment advice, but are offered as an analytical point of view which might be of interest to those who follow stock market cycles and technical analysis.
Andre Gratian Archive |
© 2005-2022 http://www.MarketOracle.co.uk - The Market Oracle is a FREE Daily Financial Markets Analysis & Forecasting online publication.


