


THE EWI ARGUMENT: A Critical Analysis of Robert Prechter and Elliott Wave International (March 2009-Present)
Stock-Markets / Elliott Wave Theory Jan 10, 2011 - 02:33 AM GMTBy: Steven_Vincent

 SUMMARY
In this article I analyze the recent work of Robert Prechter’s “Elliott Wave International”, evaluating it in terms of the quality of epistemology, methodology, data integrity, interpretation, conclusions, recommendations and results. The analysis is limited in scope to the equities markets since March of 2009. Because of time constraints, counterpoints to much of the EWI argument can only be partially developed here, but I hope to give them a much fuller treatment in my forthcoming book, tentatively entitled, "Apocalypse Not Yet: Wave V and the End of Financialism".
The source material for this study is the Elliott Wave Theorist (EWT) and Elliott Wave Financial Forecast (EWFF) as well as numerous writings and audio and video interviews with Robert Prechter and Steve Hochberg. For the sake of simplicity this body of work will be referred to as "EWI". The author had access to only the following issues for inclusion in this review: EWT issues 09/05, 09/07, 09/11-12, 04/10-12/10 and EWFF issues 09/10-01/11. I have tried to represent the record faithfully from all available sources.
This report will be delivered in approximately 5 parts with one part released each week. It's a work in progress so this will be subject to revision along the way.
Outline of presentation:
1.Elliott Wave Analysis
2.Epistemological Methodology
3.Data: Integrity and Interpretation
4.Market Timing
5.Alternatives and Conclusions
General Summary:
EWI's Elliott Wave counts are based on an assumption that markets must have peaked at a Grand Supercyle top in 2000 or 2007. There is no consideration of an alternate bullish or bearish scenario on any time frame. It's epistemology and methodology do not qualify as analysis since all material begins with a predetermined and inviolable conclusion: deflationary depression. Rather than analysis, EWI's narrative falls under the category of an advocational argument on behalf of a conclusion. In spite of claims that EWI is a technical market analysis service, its reports are comprised primarily of conclusions about the fundamental environment. Assumptions about economic and social fundamentals drive the search for data supportive of the Grand Supercycle and deflationary depression conclusions. Data cited in support of the argument for imminent deflationary depression are in each case highly debatable in terms of relevance or validity and are frequently offset and contradicted entirely by stronger data supportive of an entirely contrary conclusion. All data points are presented to support the base deflationary depression and Grand Supercycle Top assumptions only. The result of a non-analytical, biased and advocational methodology has been consistently erroneous market timing during the period under review. EWI may ultimately be proven right in its argument for the deflationary depression model. There is a viable technical and fundamental argument in support of that view. However, sound analysis must be driven by an objective search for knowledge, understanding and truth. Within the context of a very long term bearish view, the Grand Supercycle Top may yet come but in a time frame far removed from the present and at a much higher price level.
I. Elliott Wave Analysis
EWI argues that Elliott Wave patterns in US stock indices indicate a long term top is in place:
Elliott Wave Analysis: Last month’s "Bottom Line" said, “The rally’s end should come after one more recovery high.” That push is mostly played out as we go to press; when complete, it should lead to a historic downside reversal. Minor wave 5 of Intermediate wave (C) started on November 9 at 10,929.30 in the DJIA. Fifth waves are ending waves, which means that wave 5 will complete the rally from 9614.30, the July low. And the end of the advance from July will mark the top of wave 2, the entire Primary-degree bear market rally that began in March 2009. A top of this magnitude would be entirely consistent with the multi-year extremes in sentiment and the waning upside momentum. (01/11 EWFF)
Here's a chart which replicates the most recent long term count from EWI:
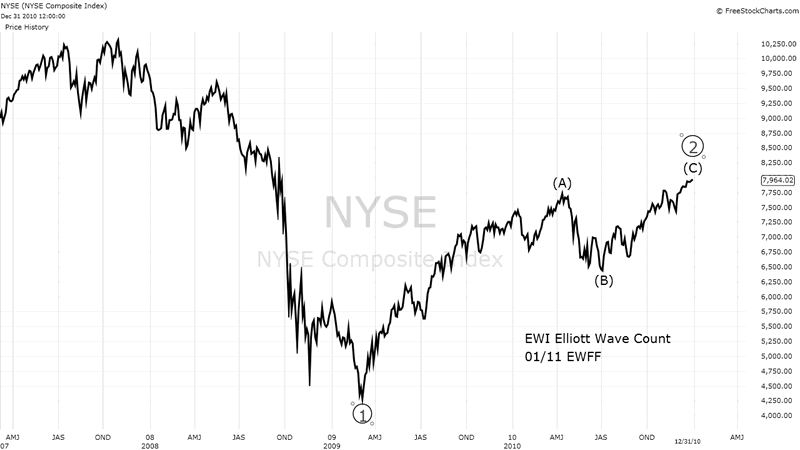
Here the March 2009 low is counted as a Major Wave 1 down and the current high is counted as a partial retracement of that move for a Major Wave 2 high.
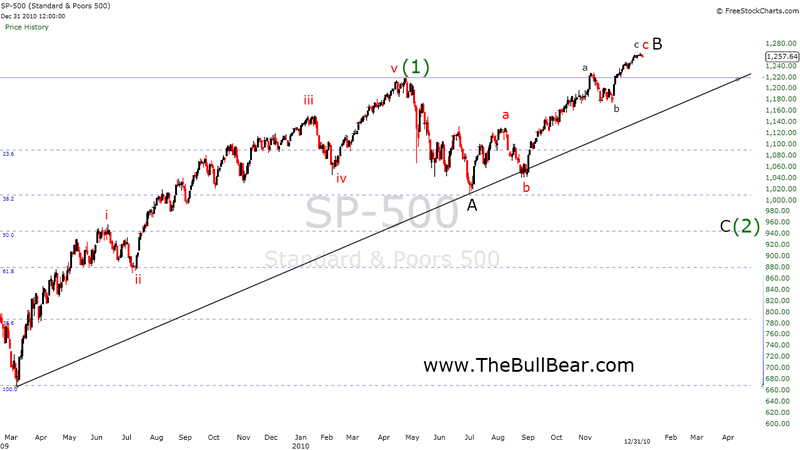
This chart replicates EWI's count of the move from the April 2010 high:
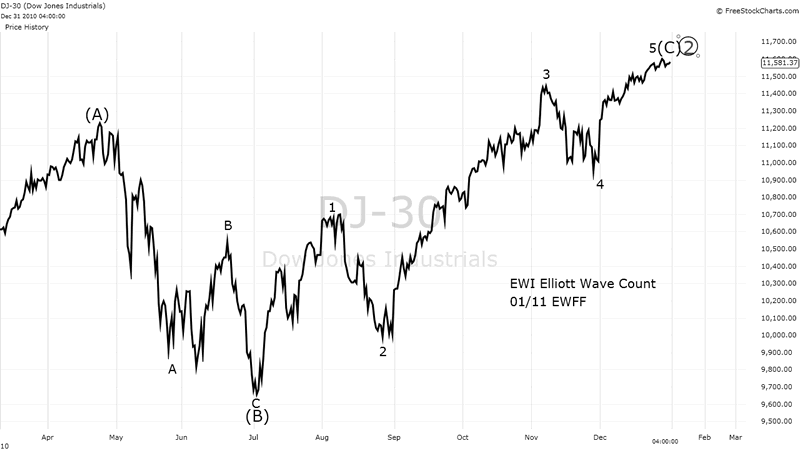
Here EWI is calling the April high as the top of a five wave "A" wave, the July bottom as the trough of a three wave "B" wave and the current high as the peak of a 5 wave "C" wave to complete Major Wave 2. Both of these charts represent viable bearish interpretations. I can't say that they should be dismissed and in fact they should be given serious consideration and in the due course of time they may indeed be proven to reflect the correct market view.
Let's look at some equally viable alternative wave counts that any good Elliott Wave analyst should be considering at this juncture. There isn't time or space here to present the full analysis behind each of these scenarios. In the course of this piece I will introduce some of the background components that support these proposed views. But in this immediate context I merely want to illustrate that there are other, viable Elliott Wave counts which should be considered.
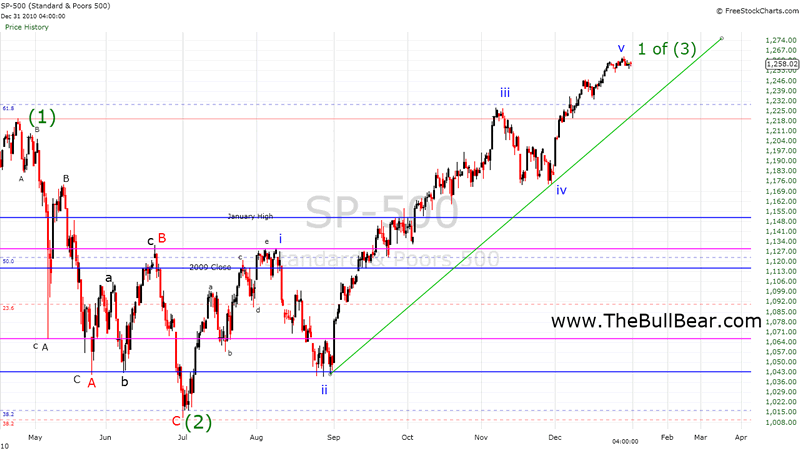
My current preferred wave count has SPX in a Wave iii of 3 of (3) position. I suspect a subminor ii correction to the zone of the April and November highs, the 61.8% Fibonnacci retracement level of the decline from the 2007 high and the uptrend from the September bottom. If that support does hold then the market is set up for a Wave 3 move four degrees deep. Note the "1-2" punches on at least three (and potentially four) levels of order setting up a Wave 3 combination move. This is just about the most bullish Elliott Wave setup possible. Also note that the 61.8% Fibonacci level of acted as resistance in April and November and was taken out decisively in December. Once that level has been surpassed on a weekly, monthly and yearly basis the chances of a full retracement are significantly enhanced.
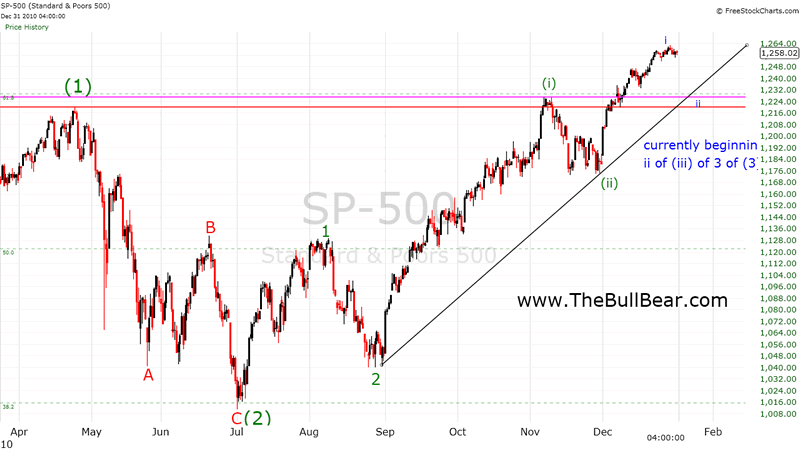
I'll briefly note in support of the above scenario that SPX has just seen a bull cross of the weekly 50 EMA over the 200 placing the long term moving averages in full bull market alignment. It's not uncommon for a market to accelerate in a Wave 3 advance off such a flash point.
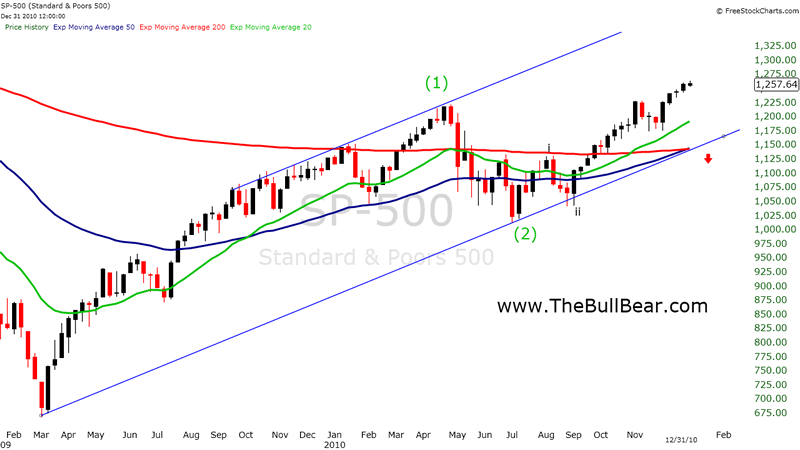
An alternative to the above scenario places SPX at the cusp of a Wave 2 correction within a 3 of (3) rally. Wave 2 could easily retrace 50% of the move off the July low and retest the June and August peaks. Recent action seems to make this view less probable.
An intermediate term bearish yet long term bullish scenario has SPX topping now into a wave B high with a final C leg down to come to complete a large ABC flat correction from the April high. The B wave is a bit unusual in structure and for that reason among others I don't favor this scenario, but it is worth contemplating.
In my view, Elliott Wave analysis should at all times contain both bullish and bearish wave counts on multiple time frames and then alternative bull and bear counts as well. The aim is to discover the present (and potentially the future) reality of the market through analysis of its wave structures. In this way the wave principle can be a powerful tool to keep the trader on the right side of the market. EWI apparently uses its wave counts to describe its conclusions about the market, rather than drawing conclusions about the market from an actual analysis of its wave structures. Although its current count calling for an imminent Wave 3 Grand Supercycle decline is definitely feasible there are bullish counts which need to be considered as well.
In the next segment in this series, I'll look at EWI's material in light of its epistemological methodology. What is EWI's approach to the acquisition and interpretation of knowledge?
Generally these reports as well as twice weekly video reports are prepared for BullBear Trading Service members and then released to the general public on a time delayed basis. To get immediate access just become a member. It's easy and currently free of charge.

Disclosure: No current positions.
By Steve Vincent
Steven Vincent has been studying and trading the markets since 1998 and is a member of the Market Technicians Association. He is proprietor of BullBear Trading which provides market analysis, timing and guidance to subscribers. He focuses intermediate to long term swing trading. When he is not charting and analyzing the markets he teaches yoga and meditation in Los Angeles.
© 2010 Copyright Steven Vincent - All Rights Reserved Disclaimer: The above is a matter of opinion provided for general information purposes only and is not intended as investment advice. Information and analysis above are derived from sources and utilising methods believed to be reliable, but we cannot accept responsibility for any losses you may incur as a result of this analysis. Individuals should consult with their personal financial advisors.
© 2005-2022 http://www.MarketOracle.co.uk - The Market Oracle is a FREE Daily Financial Markets Analysis & Forecasting online publication.