


How and Why the Banking Index is Dragging Down the S&P, Plus China Shanghai Index Update
Stock-Markets / US Stock Markets Oct 25, 2007 - 01:03 AM GMTBy: Marty_Chenard

 The S&P 500 is a key index that is watched by the Institutional Investors. Why? Because, it is the best measure of the economy with its large companies that cover a nicely balanced, diverse group of market Sectors.
One of the most important sectors on the S&P 500 are the Financials and Banks which represent about 20% of the entire S&P 500. What happens on the banking sector has a large affect on the S&P's trending and movements.
So, this morning, we will answer the following questions:
1. How has the financially weighted S&P 500 moved in comparison to the NASDAQ 100 this month?
2. Did the Banking Index drag down the S&P 500?
3. Is there a correlation with the VIX moving up and the Banking Index moving down?
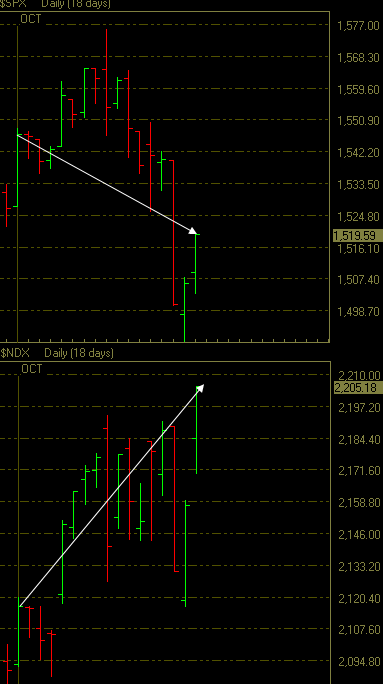
Let's address our first question: How has the financially weighted S&P 500 moved in comparison to the NASDAQ 100 this month?
Below is the October charts for the S&P 500 and the NASDAQ 100. Looking at the chart, it is clear that the NASDAQ 100 has made a profit for investors, but the S&P 500 has lost money for investors. Let's move to question 2 and see why the S&P went down ...
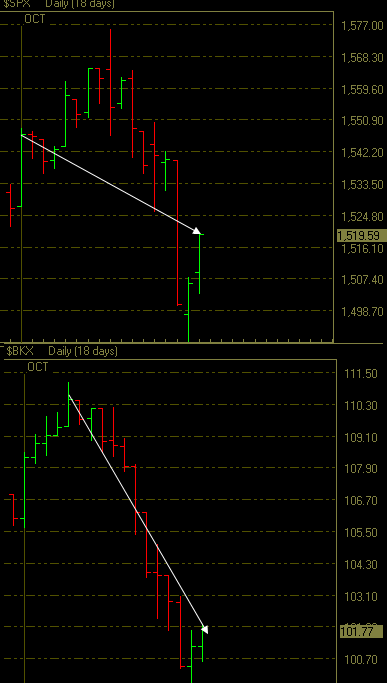
Let's address our second question: Did the Banking Index drag down the S&P 500?
This chart shows the S&P 500 and the Banking Index overlapped. By quickly looking at the chart below, you can see how the Banking Index (with its 20% influence on the S&P), has dragged down the S&P 500. The largest influence to the S&P's down action has been the financials. Now, let's go to chart 3 ...
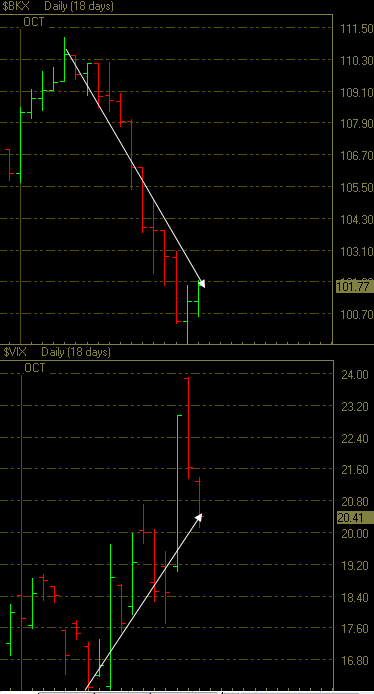
Let's address our last question: Is there a correlation with the VIX moving up and the Banking Index moving down?
Below is a chart with the Banking Index overlapped with the VIX (Volatility Index). The VIX goes opposite to the market, so it would have to move up to correlate with the Banking Index's move down. (The banking index symbol is $BKX)
Notice the correlation between the two. This is telling us that most of the market's fear right now, is centered around financial institutions and related credit/sub-prime problems.
In the next couple of days, watch and see the following: if the Banking Index moves up, will there be a corresponding down move in the VIX?
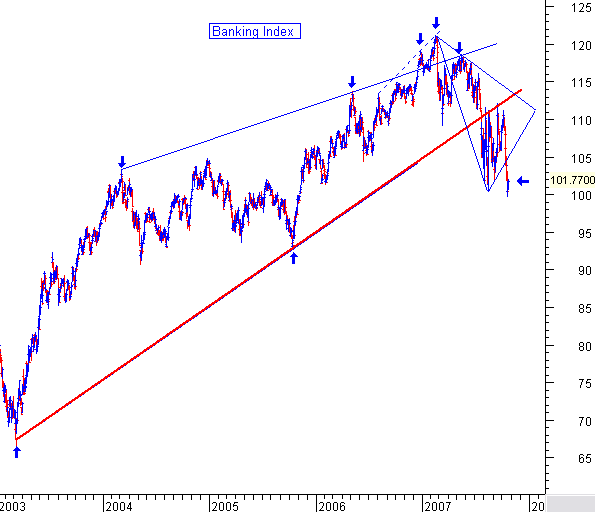
One last chart on the Banking Index ... This is the 5 year chart on the Banking Index. Note that it has broken its 5 year support line, and recently, it broke through a multi-month consolidation support.
This suggests that the Banking Index is going to continue to put pressure on the S&P 500 over the medium to longer term.
___________________________________________________
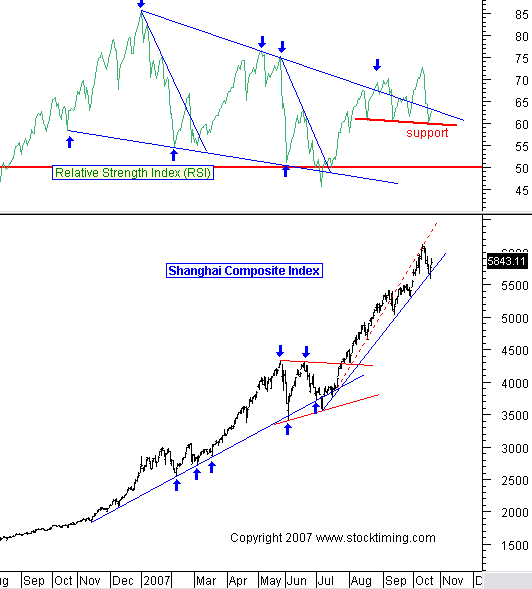
For those who are interested in what is happening on the Shanghai Index ...
Below is this morning's chart of the Shanghai Composite Index. The Shanghai Composite moved up 1.21% this morning and is back above the resistance line.
Warren Buffett is in China now. After touring some of their progress, he said that "their growth has made him a believer in their growth." However, he also said that wasn't a reflection on what was happening to their stocks. The Chinese are proud of what they are doing, and if they give a lot of play about Buffett's growth comments, that could spur investor enthusiasm in China in the next couple of days.
Note the red support line I drew on the Relative Strength this morning. It has tested the support three times so far. The Shanghai needs to hold this support to keep its current trajectory.
By Marty Chenard
http://www.stocktiming.com/
Please Note: We do not issue Buy or Sell timing recommendations on these Free daily update pages . I hope you understand, that in fairness, our Buy/Sell recommendations and advanced market Models are only available to our paid subscribers on a password required basis. Membership information
Marty Chenard is the Author and Teacher of two Seminar Courses on "Advanced Technical Analysis Investing", Mr. Chenard has been investing for over 30 years. In 2001 when the NASDAQ dropped 24.5%, his personal investment performance for the year was a gain of 57.428%. He is an Advanced Stock Market Technical Analyst that has developed his own proprietary analytical tools. As a result, he was out of the market two weeks before the 1987 Crash in the most recent Bear Market he faxed his Members in March 2000 telling them all to SELL. He is an advanced technical analyst and not an investment advisor, nor a securities broker.
Marty Chenard Archive |
© 2005-2022 http://www.MarketOracle.co.uk - The Market Oracle is a FREE Daily Financial Markets Analysis & Forecasting online publication.