


Stock Market Indices Dow, SP500, Nasdaq, Russell 2K Comparison
Stock-Markets / Stock Markets 2011 Jan 24, 2011 - 03:50 AM GMTBy: Chris_Vermeulen

 Depending what type of trader you are and what you focus on the most for trading you could be either bullish or bearish on the stock market right now. The charts below show how the Dow Jones Industrial Average is bullish while the Small-Cap Russell 2K is bearish. Options expiration last week really mixed the market up as the market makers and the big money players manipulate stock prices in their favor.
Let’s take a look at the charts…
DIA – Dow Jones Industrial Average Daily Chart
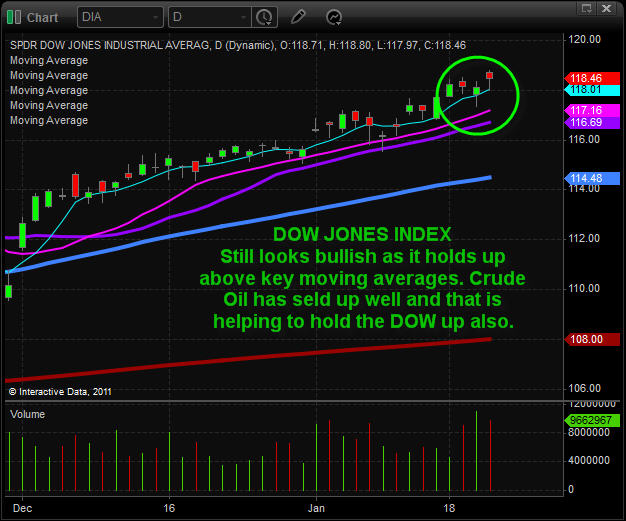
Crude oil has been holding up very well the past couple weeks and that has had an impact on the Dow. Additionally IBM had a huge move up which accounts for almost 10% of the DJIA's price action. Both these factors have skewed the Dow index to look bullish.
Currently the price is trading above the 5 period moving average after briefly tagging it on Friday and then bouncing higher. Volume has picked up indicating more people are exchanging positions because of a shift in sentiment. Remember the Dow represents only 30 stocks so it does not provide a solid view of the overall market strength.
SPY – SP500 Daily Chart
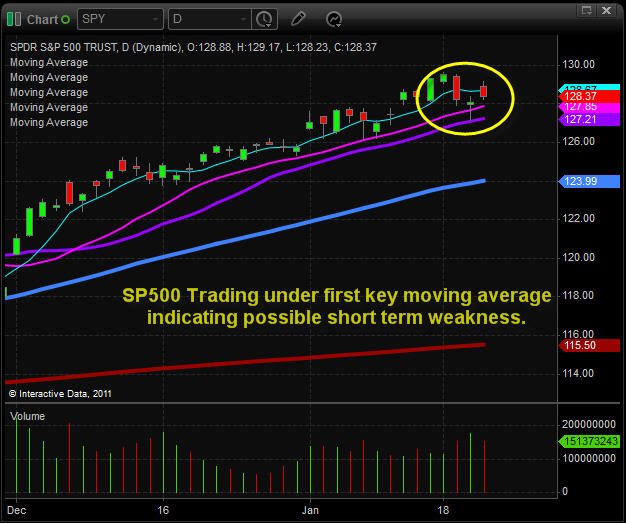
This index closed below the 5 period moving average with rising volume once again indicating a shift in trader sentiment. The SP500 is heavily weighted with financial stocks and with the financial sector under pressure last week it helped to pull this index down. The fact that it closed below the 5 period moving average is just a warning sign to be cautious. Overall trend is still up in this index.
QQQQ – NASDAQ Daily Chart
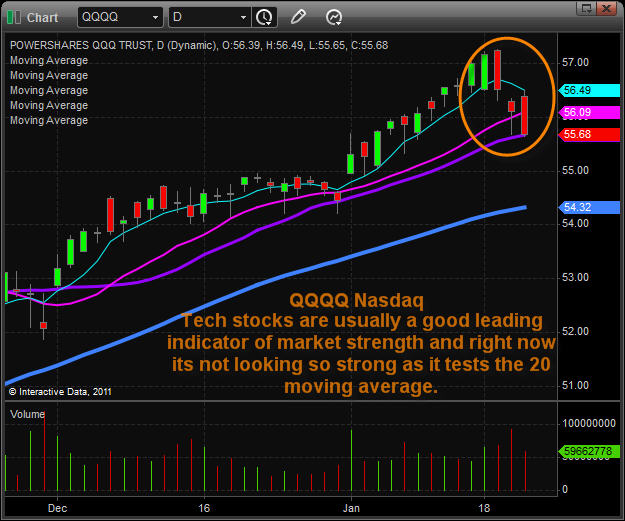
As you can see the technology heavy index (Nasdaq), there has been more selling going on. The Nasdaq closed below both key moving averages and is now testing the 20 period moving average which is the line in the sand before I’m bearish on this sector. Tech stocks are typically a good indicator for the overall health of the market and if it does not recover this week or if it forms a light volume bear flag then watch out below.
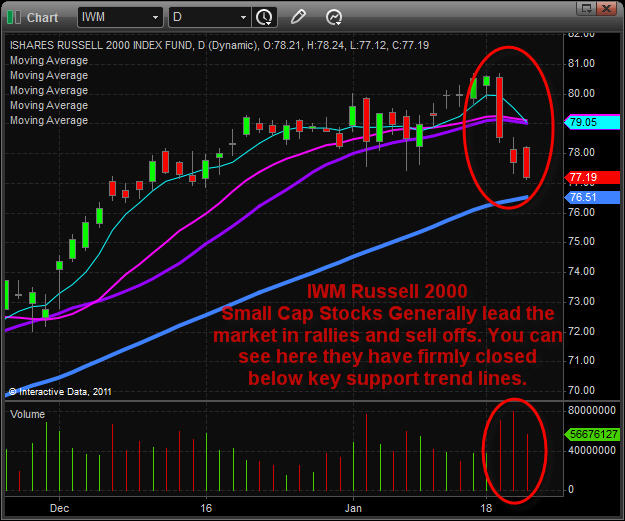
IWM – Russell 2K Small Cap Stock Index
Small cap stocks are usually the first to pullback in the market. As you can see there is a big difference between this chart and the Dow Jones…
Small caps has broken key moving averages and are now nearing the 50 period moving average which I figure will provide a small bounce or pause before crashing through it. But with the amount of selling volume happening in the small caps it could just drop through that level and keep on going. Only time will tell and its best to wait for a low risk entry point before taking a position.
Weekend Trading Conclusion:
In short, the major indexes are giving mixed signals. While the Dow and SP500 are still bullish, we are seeing tech and small cap stocks breakdown. If things work out like they have in the past then the market is truly starting to put in a top. It could still take 5-10 days to play out. Usually the market will get choppy with large up and down days back to back and volatility will rise which can be seen by watching the VIX. I am currently neutral on the market and waiting for a low risk setup to unfold.
If you would like to get more of my daily analysis to join my newsletter at www.GoldAndOilGuy.com
By Chris Vermeulen
Chris@TheGoldAndOilGuy.com
Please visit my website for more information. http://www.TheGoldAndOilGuy.com
Chris Vermeulen is Founder of the popular trading site TheGoldAndOilGuy.com. There he shares his highly successful, low-risk trading method. For 6 years Chris has been a leader in teaching others to skillfully trade in gold, oil, and silver in both bull and bear markets. Subscribers to his service depend on Chris' uniquely consistent investment opportunities that carry exceptionally low risk and high return.
This article is intended solely for information purposes. The opinions are those of the author only. Please conduct further research and consult your financial advisor before making any investment/trading decision. No responsibility can be accepted for losses that may result as a consequence of trading on the basis of this analysis.
Chris Vermeulen Archive |
© 2005-2022 http://www.MarketOracle.co.uk - The Market Oracle is a FREE Daily Financial Markets Analysis & Forecasting online publication.