


Gold Reacts to Egypt Riots
Commodities / Gold and Silver 2011 Jan 30, 2011 - 10:53 AM GMTBy: Merv_Burak

 Riots on Thursday, gold moves lower. Riots on Friday, gold moves higher. Is there rhyme and reason here? Thursday the students rioted. Friday the Muslim Brotherhood joined in the riots. Yes, there was a difference. Now it’s a wait and see what the outcome will be to better guess what next for gold.
GOLD LONG TERM
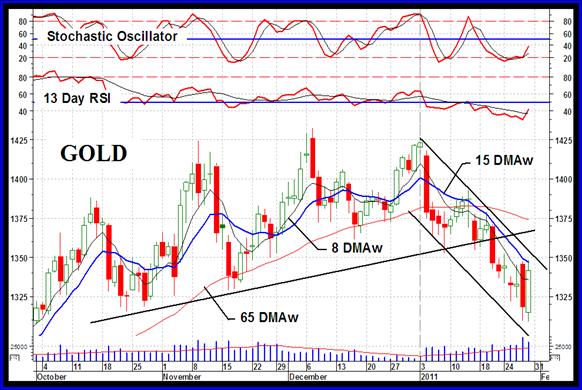
For a very strict application of my point and figure criteria the long term P&F chart has now broken on the down side for a bear market signal. However, we do still have a support at the $1320 level so a move to the $1305 level would be required to break this final support. Although the P&F criteria does give that bear signal I would be inclined to wait for the final support break before pulling my hair out and going screaming, bear, bear. The price is close enough so that it would only take another day or two to break the support, if it is so inclined. We might as well wait for the break.
Going to our normal indicators we get somewhat of a similar message. Going towards the bear but not quite there yet. Gold closed below its long term moving average line on Thursday but bounced above the line on Friday. The moving average itself is still in an upward slope. The long term momentum indicator remains in its positive zone but has been showing a weakening trend for some time. It remains below its negative trigger line. The volume indicator has been in a basic lateral path for some time now. Its trigger line has caught up with the indicator and now the indicator is oscillating above and below the trigger line as the lateral indicator trend continues. The trigger does remain slightly in a positive slope. With all that, the long term rating has now started to decrease and is at a + NEUTRAL level, one step below the bullish level.
INTERMEDIATE TERM
Well, if the long term is starting to diminish in its rating then the intermediate term should be ahead of it. That is what we have. Gold closed below its intermediate term moving average line and the line slope remains negative. The momentum indicator is still in its negative zone although it has turned to the up side and is just below its neutral line. The indicator remains below its negative sloping trigger line. As for the volume indicator, that remains just a hair below its negative sloping trigger line. After four months of a topping process one can now say that the topping has ended and we are in a downward trend. The intermediate term rating is BEARISH. This is confirmed with the short term moving average line well below the intermediate term line.
SHORT TERM
We were having a down week until Friday, when something excited gold. Now, it could be the activities in the Middle East or it could be short covering by banks or institutions. Who Knows?
There are many analysts out there in internet land much better at understanding what’s going on in the actual trading activity, who is doing what and why? All I know is what the market tells me, and that is reflected in the price and volume information. From there it’s all guess work, educated guess but still a guess. Trends, momentum, patterns, they all come into play one way or the other.
So, let’s see what we have here. After a four month topping process gold broke below its up trend line and into a down trending channel. Despite the sharp rise on Friday gold remains in the channel. Unfortunately, we have volume increasing as the down side takes hold, this is not good. One might have expected the volume to show a spike on Friday, as Oil did during its sharp upswing on Friday. The volume remaining below Thursday’s volume suggests that there was no real rush to buy gold by the mass of speculators who usually move markets but maybe only a few large shorts covering their trades with no upside follow through by the speculators.
Although gold had a nice bounce on Friday it still closed below its negative sloping moving average line. The momentum indicator perked up a bit and closed above its trigger line, turning the trigger upward but still the momentum ended the day in its negative zone. As already mentioned, the daily volume activity seems to suggest speculators getting out rather than buying in. The daily volume has been consistently above its 15 day average volume while the gold price was in a basic down trend. All in all the short term rating is BEARISH. This is further confirmed with the very short term moving average line remaining below the short term line.
As for the immediate direction of least resistance, I think I’ll forgot that guess today. The situation in the Middle East is just too volatile and may have an enormous effect on gold, one way or the other.
SILVER
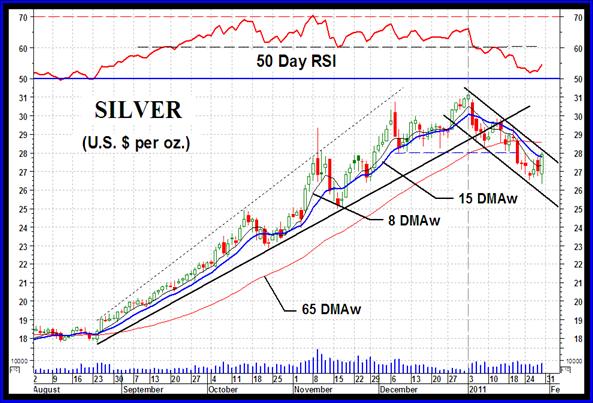
The silver chart has lots of trends, patterns and indicators. They are all telling us one story. Silver had a wonderful run, it topped out and started its down trend and now may be in a little bit of a bounce but not yet a turn around back to the up side. So, what all do we have here.
The most obvious trend is that four and a half month up trend that ended in early January. That up trend line was also the lower support line of an up trending wedge pattern, which is a pattern most often broken on the down side. Low and behold, is that a head and shoulder pattern that we see in December/January? Why yes it is. The breaking of its neckline a little over a week ago gives us a projection to the $24.73 level. Then we have that down trending channel. The silver price is still trapped inside that channel although another decent upside day and it will break above its resistance line. And along with these trends and patterns we have our normal indicators. Just a general note on the indicators before I continue. Most of the momentum indicators have been warning us of a down turn for some time. The intermediate term momentum indicator shown in the chart does show this weakening in the price strength but also shows that the strength had not gotten to the point of going negative. It has done so in the short term but not the other time periods. So this is a warning indicator but not yet a reversal of strength.
Looking at the P&F chart we have now broken below the up trend line and have a longer term projection to the $21 level. One can also calculate a still further projection to the $15.00 level but that does seem out of the picture. Still, it is there and should not be totally ignored. I find that the down side P&F projections are not as accurate as the up side ones are so take these with caution and not gospel.
As for the time period indicators, the long term is still all positive so I wouldn’t spend any time there. The long term remains BULLISH and not yet in danger of a reversal.
On the other periods, the Table shows that silver is NEG on the other time periods. Well, looking at the chart and using my normal analysis indicators we are not quite there yet with the intermediate term. We were in the bearish territory for a few days but with Friday’s action the momentum indicator has perked up and crossed its trigger line to the up side. The intermediate term rating is now at a - NEUTRAL rating, one level above a full bear but this could change with very little negative action. The short term moving average line remains below the intermediate term line confirming that we are not quite at the bullish level.
As for the short term, well the Index has closed above its short term moving average line but the line is still pointing downward. The momentum indicator is perking up and has crossed its now positive trigger line but is still in its negative zone. The short term rating has moved up to the + NEUTRAL level just a little below a full bull. The very short term moving average line has turned upwards but remains below the short term line for confirmation that the bull is not quite here yet.
PRECIOUS METAL STOCKS
The Weekly Table below tells the story of the precious metal stocks so I wouldn’t go into details this week. One note is that the Merv’s Penny Arcade Index has dropped lower this week as the one Index with weakness. That is not yet a warning of doom and gloom but something to watch should the actions of this Index be much more negative than the markets in general. As I said, not yet doom and gloom but something to keep an eye on.
Merv’s Precious Metals Indices Table
Well, that’s it for this week. Comments are always welcome and should be addressed to mervburak@gmail.com.
By Merv Burak, CMT
Hudson Aero/Systems Inc.
Technical Information Group
for Merv's Precious Metals Central
For DAILY Uranium stock commentary and WEEKLY Uranium market update check out my new Technically Uranium with Merv blog at http://techuranium.blogspot.com .
During the day Merv practices his engineering profession as a Consulting Aerospace Engineer. Once the sun goes down and night descends upon the earth Merv dons his other hat as a Chartered Market Technician ( CMT ) and tries to decipher what's going on in the securities markets. As an underground surveyor in the gold mines of Canada 's Northwest Territories in his youth, Merv has a soft spot for the gold industry and has developed several Gold Indices reflecting different aspects of the industry. As a basically lazy individual Merv's driving focus is to KEEP IT SIMPLE .
To find out more about Merv's various Gold Indices and component stocks, please visit http://preciousmetalscentral.com . There you will find samples of the Indices and their component stocks plus other publications of interest to gold investors.
Before you invest, Always check your market timing with a Qualified Professional Market Technician
Merv Burak Archive |
© 2005-2022 http://www.MarketOracle.co.uk - The Market Oracle is a FREE Daily Financial Markets Analysis & Forecasting online publication.