


Beware When Stock Markets Enter Irrational Exuberance
Stock-Markets / Stock Markets 2011 Feb 01, 2011 - 05:13 AM GMTBy: readtheticker

Thank god markets are emotional, how else would we get fantastic over bought and under bought prices. The only trick for the investor is to know when prices are considered to be within a period 'irrational exuberance'. Some use RSI and Stochastic, others use sentiment readings of confidence, option call put ratios and standard deviations from a long term moving average. Many of these tools have false readings and hence a combination is preferred when forming an opinion and unfortunately that normally end in a confused state of mind for the investor.
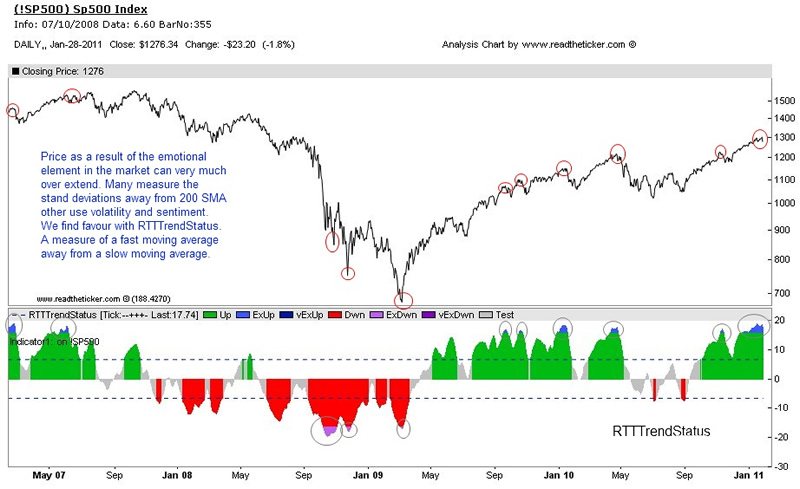
It is amazing what you can calculate when you keep it simple stupid. The best tool we could find was simply taking a fast moving average away from a slow moving in percentage terms. The indicator you see below requires explanation of the color coding.
vExUp (Dark Blue): Very Extended upwards trend
ExUp (Blue): Extend upwards trend.
Up (Green): Up trend.
Test (Gray): Trend in test mode.
Dwn (Red): Down trend.
ExDwn (Purple): Extended downwards trend.
vExDwn (Dark Purple): Very extended downwards trend.
Changes in color give adequate warning to you when price action requires your close attention. The dotted blue lines highlight when price will begin to test the trend, or as we call it entering the 'trend testing zone'.
Interpretation Points:
1) If the immediate presentation of indicator shows NO RED then the trend is bullish. This is inclusive of the indicator pulling back as far to the lower dotted blue line. 2) If the immediate presentation of indicator shows NO GREEN then the trend is bearish. This is inclusive of the indicator pulling back as far to the upper dotted blue line. 3) Changes in color require your attention to price action. 4) The more infrequent the appearance of an extended color the more likely that the reading is significant.
On this chart I have circled on the indicator were it has changed color, I have also circled on price where they match up. As you can see taking a position in the market at wrong time proves to be unwise.
I should make you aware that you best financial decisions will be born while the indicator is in a test mode or gray.
Currently, the SP500 is in a 'extended up' period of price action (blue), price are so high you need an oxygen mask. The most recent five times before price fell anywhere between 3% to 16%. But as we all know many of those was before the Jackson Hole speech by USA Fed Chairman Ben Bernanke. So we will have to see what Mr Market has in store for us. Going short may not be the solution, buying puts (just like everyone else has on the SPY) maybe the best course of action.
Of course we cant wait until we see gray again, our holiday plans rely on it(ha).
Readtheticker
My website: www.readtheticker.com
My blog: http://www.readtheticker.com/Pages/Blog1.aspx
We are financial market enthusiast using methods expressed by the Gann, Hurst and Wyckoff with a few of our own proprietary tools. Readtheticker.com provides online stock and index charts with commentary. We are not brokers, bankers, financial planners, hedge fund traders or investment advisors, we are private investors
© 2011 Copyright readtheticker - All Rights Reserved
Disclaimer: The material is presented for educational purposes only and may contain errors or omissions and are subject to change without notice. Readtheticker.com (or 'RTT') members and or associates are NOT responsible for any actions you may take on any comments, advice,annotations or advertisement presented in this content. This material is not presented to be a recommendation to buy or sell any financial instrument (including but not limited to stocks, forex, options, bonds or futures, on any exchange in the world) or as 'investment advice'. Readtheticker.com members may have a position in any company or security mentioned herein.
© 2005-2022 http://www.MarketOracle.co.uk - The Market Oracle is a FREE Daily Financial Markets Analysis & Forecasting online publication.