


Pavlov’s Bulls, the Importance of Asset Class Bubbles for Value Investors and Why They Occur
Stock-Markets / Stock Markets 2011 Feb 01, 2011 - 05:31 AM GMTBy: John_Mauldin


My long-time readers are familiar with Jeremy Grantham of GMO, as I quote him a lot. He is one of the more brilliant and talented value managers (and I should mention, very successful on behalf of his clients). He writes a quarterly letter that I regard as a must-read. In fact, anything Jeremy writes is a must-read. This week’s OTB is a little longer than most, but it is actually two separate parts, which can be read at different times – but you want to take the time. He makes his predictions for the year in the first part, and gives us some valuable insights into the stock market in the second. The first part reads quick. Think through the second part.
For those interested, I did an interview with Tanya Benedicto, a new and upcoming blogger from Forbes, from The Breakers in Palm Beach. She reminds me of my twins. Other than calling me MR. Mauldin, it was a good interview and a short five minutes on what has me disconcerted this week. Here is the link: http://blogs.forbes.com/tanyabenedicto/2011/01/30/thoughts-from-the-frontline/.
Enjoy your week. I am off to Vegas and then Thailand, assuming the predicted ice storm allows me to get out of Dallas. And figure out a time to write an e-letter. And for fun, I offer a picture of something David Walker handed me as we were getting ready to do our panel last Thursday.
Your really excited about Thailand analyst,
Pavlov’s Bulls
Jeremy Grantham
About 100 years ago, the Russian physiologist Ivan Pavlov noticed that when the feeding bell was rung, his dogs would salivate before they saw the actual food. They had been “conditioned.” And so it was with “The Great Stimulus” of 2008-09. The market’s players salivated long before they could see actual results. And the market roared up as it usually does. That was the main meal. But the tea-time bell for entering Year 3 of the Presidential Cycle was struck on October 1. Since 1964, “routine” Year 3 stimulus has helped drive the S&P up a remarkable 23% above any infl ation. And this time, the tea has been spiced with QE2. Moral hazard was seen to be alive and well, and the dogs were raring to go. The market came out of its starting gate like a greyhound, and has already surged 13% (by January 12), leaving the average Year 3 in easy reach (+9%). The speculative stocks, as usual, were even better, with the Russell 2000 leaping almost 19%. We have all been well-trained market dogs, salivating on cue and behaving exactly as we are expected to. So much for free will!
Recent Predictions …
From time to time, it is our practice to take a look at our predictive hits and misses in an important market phase. I’ll try to keep it brief: how did our prognostication skill stand up to Pavlov’s bulls? Well, to be blunt, brilliantly on general principle; we foretold its broad outline in my 1Q 2009 Letter and warned repeatedly of the probable strength of Year 3. But we were quite disappointing in detail.
The Good News …
For someone who has been mostly bearish for the last 20 years (of admittedly generally overpriced markets), I got this rally more or less right at the macro level. In my 1Q 2009 Letter, I wrote, “I am parting company with many of my bearish allies for a while … we could easily get a prodigious response to the greatest monetary and fiscal stimulus by far in U.S. history … we are likely to have a remarkable stock rally, far in excess of anything justified by either long-term or short-term economic fundamentals … [to] way beyond fair value [then 880] to the 1000-1100 level or so before the end of the year.” As a consequence, in traditional balanced accounts, we moved from an all-time low of 38% in global equities in October 2008 to 62% in March 2009. (If only that had been 72%, though, as, in hindsight, it probably should have been.) In the same Letter, I said of the economy, “The current stimulus is so extensive globally that surely it will kick up the economies of at least some of the larger countries, including the U.S. and China, by late this year …”
On one part of the fundamentals we were, in contrast, completely wrong. On the topic of potential problems, I wrote, “Not the least of these will be downward pressure on profit margins that for 20 years had benefited from rising asset prices sneaking through into margins.” Why I was so wrong, I cannot say, because I still don’t understand how the U.S. could have massive numbers of unused labor and industrial capacity yet still have peak profit margins. This has never happened before. In fact, before Greenspan, there was a powerful positive correlation between profit margins and capacity in the expected direction. It is one of the reasons that we in asset allocation strongly suspect the bedrock on which these fat profits rest. We still expect margins to regress to more normal levels.
On the topic of resource prices, my long-term view was, and still is, very positive. Not that I don’t expect occasional vicious setbacks – that is the nature of the beast. I wrote in my 2Q 2009 Letter, “We are simply running out of everything at a dangerous rate … We must prepare ourselves for waves of higher resource prices and periods of shortages unlike anything we have faced outside of wartime conditions.”
In homage to the Fed’s remarkable powers to move the market, I argued in successive quarters that the market’s “line of least resistance” was up – to the 1500 range on the S&P by October 2011. That outlook held if the market and economy could survive smaller possibilities of double-dips. On fundamentals, I still believe that the economies of the developed world will settle down to growth rates that are adequate, but lower than in the past, and that we are pecking our way through my “Seven Lean Years.” We face a triple threat in this regard: 1) the loss of wealth from housing, commercial real estate, and still, to some extent, the stock market, which stranded debt and resulted in a negative wealth effect; 2) the slowing growth rate of the working-age population; and 3) increasing commodity prices and periods of scarcity, to which weather extremes will contribute. To judge the accuracy of this forecast will take a while, but it is clear from the early phases that this is the worst-ever recovery from a major economic downturn, especially in terms of job creation.
And the Bad News …
We pointed out that quality stocks – the great franchise companies – were the cheapest stock group. Cheapness in any given year is often a frail reed to lean upon, and so it was in 2009 and again last year, resulting in about as bad a pasting for high quality as it has ever had. We have already confessed a few times to the crime of not being more open to the beauties of riskier stocks in a Fed-driven market. And in the name of value, we underperformed. Reviewing this experience, we feel that it would have been reasonable to have shifted to at least an increased percentage of risky investments after March 2009, because some of them, notably emerging market equities, did have estimates almost as high as quality. In fact, some were well within the range of our normal estimating error, although, of course, quality stocks were not only the least expensive, they were also the least risky, often a formidable combination. But even if we had made such a move at the lows, more extreme value discrepancies by early 2010 would have compelled us to move back to our present position – heavily overweight quality stocks – that we have carried for several years. Our sustained heavy overweight in quality stocks in 2009 was painful, intellectually and otherwise. Our pain in 2010 was more “business as usual,” waiting for the virtues of value to be revealed. The saving grace is that, although value is a weak force in any single year, it becomes a monster over several years. Like gravity, it slowly wears down the opposition.
The fundamentals have also worked against quality, with lower quality companies and small caps posting better earnings. They typically respond better to Fed-type stimulus. But like other components of value, profit margins always move remorselessly back to their long-term averages, or almost always.
January 2011
So, where are we now? Although “quality” stocks are very cheap and small caps are very expensive (as are lower quality companies), we are in Year 3 of the Presidential Cycle, when risk – particularly high volatility, but including all of its risky cousins – typically does well and quality does poorly. Not exactly what we need! The mitigating feature once again is an extreme value discrepancy in our favor, but this never matters less than it does in a Year 3. This is the age-old value manager’s dilemma: we can more or less depend on quality winning over several years, but it may well underperform for a few more quarters. We have always felt we should lean more heavily on the longer-term higher confidence.
As a simple rule, the market will tend to rise as long as short rates are kept low. This seems likely to be the case for eight more months and, therefore, we have to be prepared for the market to rise and to have a risky bias. As such, we have been looking at the previous equity bubbles for, if the S&P rises to 1500, it would officially be the latest in the series of true bubbles. All of the famous bubbles broke, but only after short rates had started to rise, sometimes for quite a while. We have only found a couple of unimportant two-sigma 40-year bubbles that broke in the midst of declining rates, and that was nearly 50 years ago. The very famous, very large bubbles also often give another type of warning. Probably knowing they are dancing close to the cliff and yet reluctant to stop, late in bubbles investors often migrate to safer stocks, and risky stocks betray their high betas by underperforming. We can get into the details another time, but suffice it to say that there are usually warnings, sometimes several, before a bubble breaks. Overvaluation must be present to define a bubble, but it is not a useful warning in and of itself.
I fear that rising resource prices could cause serious inflation in some emerging countries this year. In theory, this could stop the progress of the bubble that is forming in U.S. equities. In practice, it is unlikely to stop our market until our rates have at least started to rise. Given the whiffs of deflation still lingering from lost asset values, the continued weak housing market, weak employment, and very contained labor costs, an inflationary scare in the U.S. seems a ways off.
Commodities, Weather, and Markets
Climate and weather are hard to separate. My recommendation is to ignore everything that is not off the charts and in the book of new records. The hottest days ever recorded were all over the place last year, with 2010 equaling 2005 as the warmest year globally on record. Russian heat and Pakistani floods, both records, were clearly related in the eyes of climatologists. Perhaps most remarkable, though, is what has been happening in Australia: after seven years of fierce drought, an area the size of Germany and France is several feet under water. This is so out of the range of experience that it has been described as “a flood of biblical proportions.” More to the investment point: Russian heat affects wheat prices and Australian floods interfere with both mining and crops. Weather-induced disappointment in crop yield seems to be becoming commonplace. This pattern of weather extremes is exactly what is predicted by the scientific establishment. Snow on Capitol Hill, although cannon fodder for some truly dopey and ill-informed Congressmen, is also perfectly compatible. Weather instability will always be the most immediately obvious side effect of global warming.
One last story, which is far from hard science, but to me at least intriguing; I support research being done by the New England Aquarium on the right whale (so called because it was just perfect for catching, killing, and turning into whale oil). We had lunch with the right whale expert one month ago – hot off the press! – and were informed of a new development. Three hundred and fifty or so right whales (out of the remaining population of some 500, down from at least hundreds of thousands), have always shown up in late summer for several weeks of feeding in the Bay of Fundy. This year, for the first time in the 30 years of the study, they were “no shows.” Calling up and down the coast, they were able to locate only 100 of them (all known by sight as individuals; none of which stayed more than a day or two anywhere). It is hoped that their food supply had simply moved to another location. The cause for this is unknown and may take years to be very confident of, but the most likely candidate is that extra cold fresh water run-off from melting ice, mainly Greenland, had shifted currents or interfered in other ways with the location of their food. If indeed the cause were accelerated run-off, then this would be completely compatible with another long-established hypothesis: that extra cold fresh water from Greenland might cool the Gulf Stream, the great conveyor of heat to Great Britain and Northern Europe. If this were in fact the case, then London would wake up and find itself feeling a lot more like Montreal – on the same latitude – than it is used to, producing, for example, the winter there that all travelers are reading about today.
You read it here first, and conservative scientists will perhaps be writing it up in a learned journal in two or more years. It is, though, a wonderfully simple example of how a warm winter in the Northern ice might have destabilized systems, ultimately resulting in a frigid Northern Europe.
Resource Limitation Note
For my money, resource problems exacerbated by weather instability will be our biggest and most complicated investment problem for years to come. How should we prepare for it? First, we should all transfer more of our intellectual resources to the problem. Yes, we have already recommended forestry, agricultural land, and “stuff in the ground.” It would be nice to back this up with more detail. To this end, we are starting to look more closely at commodity cycles, both historically and currently. We will report back from time to time.
By the way, the good news is that our long-term bubble study, started in 1998, has become a monster. Formerly a study of the handfuls of famous, accepted investment bubbles, we are now well into a statistically rigorous review of primary, secondary, and possibly even tertiary bubbles, and now count a stunning 320 completed bubbles. For now, we do not intend to make our complete review generally available, but we will review some interesting “average” bubble behavior in a few months.
So, we do know some useful stuff about commodities. The complicating point is that in the recent few years, commodities seem to be making a paradigm shift. If this is so, it will be the most important paradigm shift to date. The bad news is that paradigm shifts cannot, by definition, be described well using history. It is all about judgment. Now there’s a real problem.
Looking Forward
• Be prepared for a strong market and continued outperformance of everything risky.
• But be aware that you are living on borrowed time as a bull; on our data, the market is worth about 910 on the S&P 500, substantially less than current levels, and most risky components are even more overpriced.
• The speed with which you should pull back from the market as it advances into dangerously overpriced territory this year is more of an art than a science, but by October 1 you should probably be thinking much more conservatively.
• As before, in our opinion, U.S. quality stocks are the least overpriced equities.
• To make money in emerging markets from this point, animal sprits have to stay strong and not much can go wrong. This is possibly the last chapter in a 12-year love affair. Emerging equities seem to be in the early stages of the “Emerging, Emerging Bubble” that, 3½ years ago, I suggested would occur. How far a bubble expands is always anyone’s guess, but from now on, we must be more careful.
• For those of us in Asset Allocation, currencies are presently too iffy to choose between. Occasionally, in our opinion, one or more get far out of line. This is not one of those occasions.
• Resource stocks, as in “stuff in the ground,” are likely to be fine investments for the very long term. But short term, they can really ruin a quarter, and they have certainly moved a lot recently.
• We think forestry is still a good, safe, long-term play. Good agricultural land is as well.
• What to watch out for: commodity price rises in the next few months could be so large that governmental policies in emerging countries might just stop the global equity bull market. My guess, though, is that this is not the case in the U.S. just yet.
Things that Really Matter in 2011 and Beyond (in one person’s view) for Investments and Real Life
• Resources running out, putting strong but intermittent pressure on commodity prices
• Global warming causing destabilized weather patterns, adding to agricultural price pressures
• Declining American educational standards relative to competitors
• Extraordinary income disparities and a lack of progress of American hourly wages
• Everything else.
SPECIAL TOPIC
January 2011
Letters to the Investment Committee XVII
Speech at the Annual Benjamin Graham and David Dodd Breakfast (Columbia University, October 7, 2009), edited for reading.
Part 2: On the Importance of Asset Class Bubbles for Value Investors and Why They Occur
Jeremy Grantham
To set the scene for Part 2, let me repeat some of my opening paragraph from Part 1: “I’ve also been pretty irritated by Graham-and-Doddites because they have managed to deduce from a great book of 75 years ago, Security Analysis, that somehow bubbles and busts can be ignored. You don’t have to deal with that kind of thing, they argue, you just keep your nose to the grindstone of stock picking. They feel there is something faintly speculative and undesirable about recognizing bubbles. It is this idea, in particular, that I want to attack today, because I am at the other end of the spectrum: I believe the only things that really matter in investing are the bubbles and the busts. And here or there, in some country or in some asset class, there is usually something interesting going on in the bubble business.”
Moving on to asset bubbles and how they form brings us to Exhibit 1. It shows how I think the market works. Remember, when it comes to the workings of the market, Keynes really got it. Career risk drives the institutional world. Basically, everyone behaves as if their job description is “keep it.” Keynes explains perfectly how to keep your job: never, ever be wrong on your own. You can be wrong in company; that’s okay. For example, every single CEO of, say, the 30 largest financial companies failed to see the housing bust coming and the inevitable crisis that would follow it. Naturally enough, “Nobody saw it coming!” was their cry, although we knew 30 or so strategists, economists, letter writers, and so on who all saw it coming.
Exhibit 1. The Way the Investment World Goes Around: They Were Managing Their Careers, Not Their Clients’ Risk
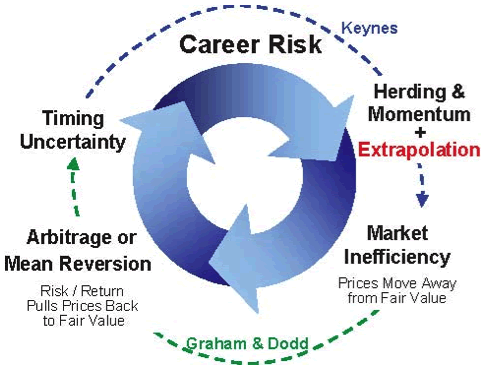
But in general, those who danced off the cliff had enough company that, if they didn’t commit other large errors, they were safe; missing the pending crisis was far from a sufficient reason for getting fired, apparently. Keynes had it right: “A sound banker, alas, is not one who foresees danger and avoids it, but one who, when he is ruined, is ruined in a conventional and orthodox way along with his fellows, so that no one can really blame him.” So, what you have to do is look around and see what the other guy is doing and, if you want to be successful, just beat him to the draw. Be quicker and slicker. And if everyone is looking at everybody else to see what’s going on to minimize their career risk, then we are going to have herding. We are all going to surge in one direction, and then we are all going to surge in the other direction. We are going to generate substantial momentum, which is measurable in every financial asset class, and has been so forever. Sometimes the periodicity of the momentum shifts, but it’s always there. It’s the single largest inefficiency in the market. There are plenty of inefficiencies, probably hundreds. But the overwhelmingly biggest one is momentum (created through a perfectly rational reason, Paul Woolley would say): acting to keep your job is rational. But it doesn’t create an efficient market. In fact, in many ways this herding can be inefficient, even dysfunctional.
Keynes also had something to say on extrapolation, which is very central to the process of momentum. He said that extrapolation is a “convention” we adopt to deal with an uncertain world, even though we know from personal experience that such an exercise is far from stable. In other words, by definition, if you make a prediction of any kind, you are taking career risk. To deal with this risk, economists, for example, take pains to be conservative in their estimates until they see the other guy’s estimates. One can see how economists cluster together in their estimates and, even when the economy goes off the cliff, they will merely lower their estimates by 30 basis points each month, instead of whacking them down by 300 in month one. That way, they can see what the other guy is doing. So they go down 30, look around, go down another 30, and so on. And the market is gloriously inefficient because of this type of career-protecting gamesmanship.
But there is a central truth to the stock market: underneath it all, there is an economic reality. There is arbitrage around the replacement cost. If you can buy a polyethylene plant in the market for half the price of building one, you can imagine how many people will build one. Everybody stops building and buys their competitors’ plants via the stock market. You run out of polyethylene capacity, the price eventually rises and rises until you sharpen your pencil and find you can build a new plant, with a safety margin and a decent return, and the cycle ends. Conversely, if you can lay fiber-optic cable and have it valued in the marketplace at three times the price that it cost you to install, then you will sell a few shares and lay some more cable, until you drown in fiber-optic cable, which is exactly what happened in 2001 and 2002.
The problem is that some of these cycles happen really fast, and some happen very slowly. And the patience of the client is three point zero zero years. If you go over that time limit, you are imperiled, and some of these cycles do indeed exceed it. You lose scads of business, as GMO did in 1998 and 1999. This timing uncertainty is what creates career and business risk. This is really a synopsis of Keynes’ Chapter 12 without the elegance. Exhibit 1 also divides the process into the Keynes part and the Graham and Dodd part.
Another word about extrapolation. Extrapolation is another way of understanding the market. Exhibit 2 (Bond Market and Inflation) is my favorite extrapolation exhibit. It shows how the long Government Bond has traditionally extrapolated the short-term inflation rate into the distant future. You can see how inflation peaked at 13% in 1982. Now, with inflation at 13%, you would expect the T-bill to yield around 15%. It did. How about the 30-year Bond? It yielded 16%. The 30-year Bond took an extreme point in inflation (13%) that existed for all of about 20 minutes and extrapolated it for 30 years! Of course, with an added 3% for a real return. Volcker was snorting flames that he was going to crush inflation or die in the attempt, and they still extrapolated 13% for 30 years. Then, in 2003, infl ation was down to 2% and the 30-year Bond was down to 5%. 2% inflation plus three points of real return again. Oh, it was going to stay at 2% for 30 years this time? It’s incredibly naïve extrapolation, isn’t it? And, in a way, the stock market is even worse. Exhibit 3 shows the ebb and flow of P/E. In an efficient world, it would be far more stable. Andrew Lo of MIT said that the market has two phases: a lot of the time it is efficient and then – bang! – it will become crazy for a while. This is not at all how I see it. Every time the market crosses fair value, it’s efficient. For a few seconds every five or six or seven years, it’s efficient. The rest of the time, it is spiking up or spiking down, and is inefficient.
Exhibit 2. Long-Term Bond Yields – Extrapolation at its Best
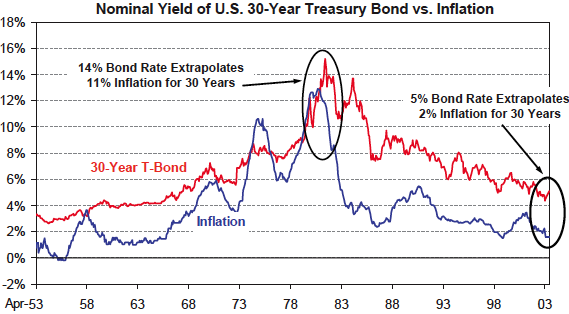
Source: GMO As of 9/30/04
Exhibit 3 – P/Es and Profit Margins: Double-Counting at its Worst (Why Shiller Is Right)
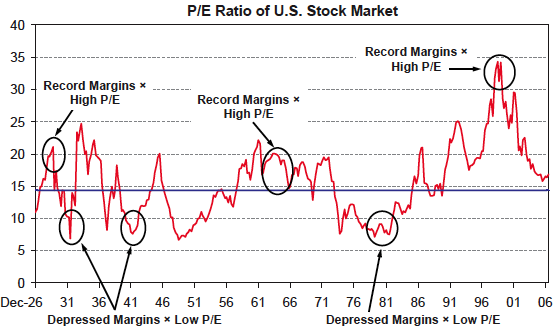
Source: GMO, Standard & Poor’s As of 6/30/07
Now, the market should equal replacement cost, which means the correlation between profit margins and P/Es should be −1. Or, putting it in simpler terms, if you had a huge profit margin for the whole economy, capitalism being what it is, you would want to multiply it by a low P/E because you know high returns will suck in competition, more capital, and bid down the returns (conversely at the low end). But what actually happens? Instead of having a correlation of −1, our research shows it has a correlation of +.32. The market can’t even get the sign right! High profit margins receive high P/Es and vice versa, and the correlation is much greater than +.32 at the peaks and the troughs. Right at the peak in 1929, we had record profit margins and record P/Es. In 1965, there were new record profit margins and record P/Es (21 times). Now, think about 2000. We had a new high in stated profit margins and decided to multiply it by 35 times earnings, a level so much higher than anything that had preceded it. In complete contrast, in 1982 we had half-normal profits times half-normal P/Es (8 times). I mean, give me a break. We were getting nearly one-third of replacement cost at the low, and almost three times replacement cost at the high in 2000. This double counting is, for me, the great driver of market volatility and, basically, it makes no sense. Once profit margins start to roll, investors look around at the competition, who are all going along for the ride, and we get overpricing as a result. It is a classic fallacy of composition. For an individual company, having an exceptional profit margin deserves a premium P/E against its competitors. But for the market as a whole, for which profit margins are beautifully mean reverting, it is exactly the reverse. This apparent paradox seems to fool the market persistently.
The process we’ve been looking at – career risk, herding momentum, extrapolation, and double counting – allows, even facilitates, the process of asset class bubbles forming. But asset bubbles don’t spring out of the ground entirely randomly. They usually get started based on something real – something new and exciting or impressive, like unusually strong sales, GDP, or profits, which allow the imagination to take flight. Then, when the market is off and running, momentum and double counting (among other factors) allow for an upward spiral far above that justified by the fundamentals. There is only one other requirement for a bubble to form, and that is a generous supply of money. When you have these two factors – a strong, ideally nearly perfect economy and generous money – you are nearly certain to have a bubble form.
Forecasting bubbles, though, is problematic. It is hard work and involves predictions and career risk. Whether bubbles will break, though, is an entirely different matter. Their breaking is certain or very nearly certain, and that sort of prognosticating is much more appealing to me as a job description. Any value manager worth his salt can measure when there is a large bubble. To avoid exploiting bubbles is intellectual laziness or pure chickenry and is a common failing, in my opinion, in otherwise sensible and suitably brave Graham and Doddites.
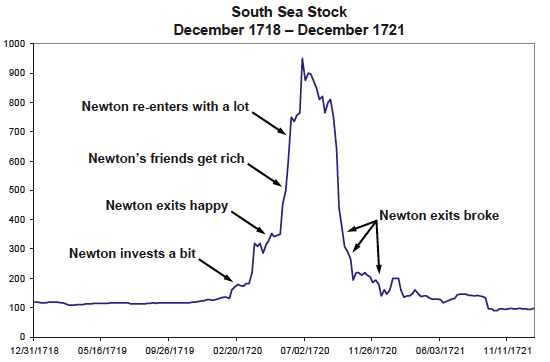
I unabashedly worship bubbles. One of the very early ones – the famous South Sea Bubble – is shown in Exhibit 4. It’s beautiful, isn’t it? The shape is perfect. The average of all of the bubbles we have studied, by the way, is that they go up in three and a half years, and down in three. Let me just say a word about that: 34 bubbles is not a surprising number to an efficient market believer. Randomly, one would expect some outliers. So, we have a nice little body of 34 to study. But here’s the problem: in the efficient market view, when a bubble forms, it is seen as a paradigm shift – a genuine shift in the very long-term value of an asset class or an industry. If that were the reason – a fundamental change, not the package of basically behavioral factors we’ve described – then what would happen following these peaks in an efficient world? Why, the prices would wander off on an infinite variety of flight paths, half of them upwards and half downwards with, I suppose, one or two nearly sideways. What happens exactly in our inconvenient real world? All of them go back to the original trend, the trend that was in place before the bubble formed. Take the U.S. housing bubble, for example. Based on its previous history of price and volatility, it was a three-sigma, 100-year bubble. What were the odds that it would be followed by a beautiful-looking bust of equal and opposite form? Why, 1 in 100, of course. So a three-sigma bubble should form randomly and burst every 100 x 100 years, or every 10,000 years, like clockwork. And the more frequent two-sigma, 40-year completed bubbles would occur every 1,600 years. Yet we have had 34 out of 34 complete bubble cycles, which would allow several universes to grow cold before occurring randomly.
Exhibit 4 – Isaac Newton’s Nightmare
South Sea Stock December 1718 – December 1721
Marc Faber, Editor and Publisher of “The Gloom, Boom & Doom Report.”
This is one of the many reasons that I am wildly enthusiastic about both rational expectations and the efficient market hypothesis. (Yes, I know we are still waiting for the aberrant U.K. and Aussie housing bubbles to break. And one day they will. Even with their variable rate mortgages to support them in bad times as the rates drop. I recently met a Brit paying ¾ of 1%. No kidding.)
Exhibit 4 also tells you a little bit about Isaac Newton, which may be true and, in any case, is a great story. Newton had the great good luck to get into the South Sea Bubble early. He made a really decent investment and a very quick killing, which mattered to him. It was enough to count. He then got out, and suffered the most painful experience that can happen in investing: he watched all of his friends getting disgustingly rich. He lost his cool and got back in, but to make up for lost time, he got back in with a whole lot more (some of it borrowed), nicely caught the decline, and was totally wiped out. And he is reported to have said something like, “I can calculate the movement of heavenly bodies but not the madness of men.”
Exhibit 5 shows six bubbles from 2000. You can see how perfect they are. My favorite is not the NASDAQ, even though it went up two and a half times in three years and down all the way in two and a half years. My favorite is the Neuer Markt in Germany, which went up twelve times in three years, and lost every penny of it in two and a half years. That is pretty impressive. It’s even better than the South Sea Bubble. Whatever we English could do, the Germans could do better…
Exhibit 5 – Perfect Bubbles of 2000
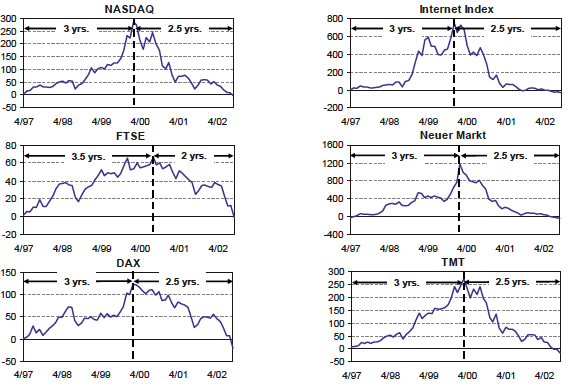
Source: GMO, Datastream As of 9/30/02
Exhibit 6 is the U.S. housing bubble. We were showing this exhibit (cross my heart and hope to die) half way up that steep ascent. One reason we were so impressed with it is that there had never been a housing bubble in American history, as Robert Shiller pointed out and was clear in the data. Previously, Chicago would boom, but Florida would bust. There was always enough diversification. It took Greenspan. It took zero interest rates. It took an amazing repackaging of mortgage instruments. It took people begging other people to take equity out of their houses to buy another one down in Florida. (We had neighbors who ended up with three…) It was doomed, but, right at the peak (October 2006), Bernanke said, “The U.S. housing market largely reflects a strong U.S. economy … the U.S. housing market has never declined.” (Meaning, of course, that it never would.) What the hell was he thinking?! This is the
Exhibit 6 – U.S. Housing Bubble Has Burst
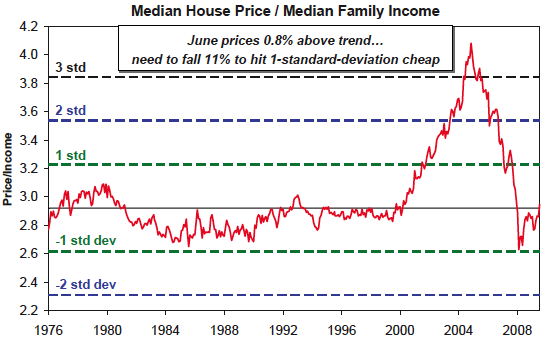
Source: National Association of Realtors, U.S. Census Bureau, GMO As of 6/30/10
guy who got reappointed. Surrounded by statisticians, he could not see a three-sigma housing bubble in a market that previously had never had one lousy bubble at all. I say it is akin to the Chicago story where two economics professors cross the quadrangle, pass a $10 bill on the ground, and don’t pick it up because they know, in an efficient world, it wouldn’t be there since it would already have been picked up. Bernanke couldn’t see a housing bubble because he knew we don’t have housing bubbles – bubbles don’t exist in big asset classes because the market is efficient. As Kindleberger, the well-regarded economics historian said, the efficient market people (like Fama, French, Cochrane, Lucas, and Malkiel) “ignore the data in defense of a theory.”
The twelve famous bubbles we always list are shown in Exhibit 7. The top row shows various stock markets: 1929, 1965, Japan, and 2000. Regarding 2000, we can see that, until 2008, the U.S. market did not get to trend. It has an interesting shape, including a wonderful several-year rally. I am pleased to say that in 2004 and 2005, I described the market’s ascent as “the greatest sucker rally in history,” so I was very relieved that it wiped out and completed the bubble cycle by bursting in 2009, with interest, as shown in Exhibit 8. So, in the end, Uncle Alan and his interest rate heroics only postponed the inevitable. Perhaps it will be the same again. The surge of bailout money certainly prevented the market from going as low this time as would have been justified by the severity of the crisis. Based on history, an appropriate decline would have been into the 400s or 500s on the S&P.
Exhibit 7
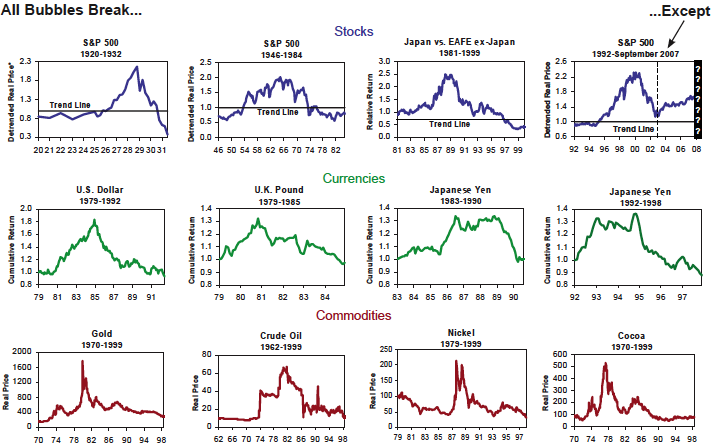
Note: For S&P charts, trend is 2% real price appreciation per year.
* Detrended Real Price is the price index divided by CPI+2%, since the long-term trend increase in the price of the S&P 500 has been on the order of 2% real.
Source: GMO As of 10/10/08
Exhibit 8 – The 2000 S&P 500 Bubble Finally Breaks!
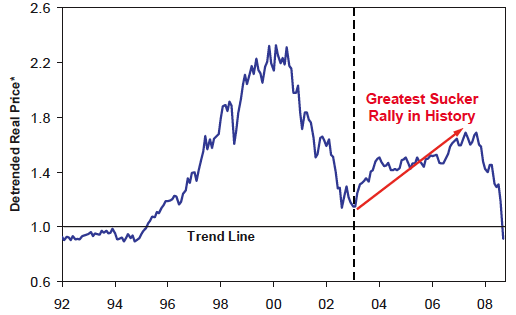
Note: Trend is 2% real price appreciation per year.
* Detrended Real Price is the price index divided by CPI+2%, since the long-term trend increase in the price of the S&P 500 has been on the order of 2% real.
Source: GMO As of 10/10/08
Stock market sectors have also bubbled unfailingly – growth stocks, value stocks, Japanese growth stocks, etc. In fact, they’ve been very dependable. To ignore them, I believe, is to avoid one of the best, easiest ways of making money. At Batterymarch we invested in small cap value in 1972-73 because we had created a chart of the ebb and flow of the relative performance of small cap that went back to 1925, and we could see this big cycle of small caps. We saw the same ebbing and flowing with value. We made a ton of dough: in just eight years, Batterymarch went from $45 million under management in late 1974 to being one of the largest, if not the largest, independent counseling firm by 1982. It did so mostly without my help, since I left in 1977, although I did bequeath my best-ever idea – small cap value. Small cap value didn’t merely win; it won by over 200 percentage points. Small cap itself won by over 100 points (+322% versus +204%). Batterymarch and GMO, which continued that tradition, won by over 100 points. But we didn’t keep up with small cap value, and that has been a lesson that has echoed through my life: we hit the most mammoth of home runs, and yet couldn’t beat the small cap value benchmark. (One reason was that we were picking higher quality stocks – the real survivors. From its bottom in 1974, the index was supercharged by a small army of tiny stocks selling at, say, $1-⅞ a share. These stocks, which were ticketed for bankruptcy if the world stayed bad for two more quarters, instead quadrupled in price in the six months following the market turn.) Picking the right sector was, in that case, more powerful than individual stock picking. Such themes are very, very hard to beat.
Let me end by emphasizing that responding to the ebbs and flows of major cycles and saving your big bets for the outlying extremes is, in my opinion, easily the best way for a large pool of money to add value and reduce risk. In comparison, waiting on the railroad tracks as the “Bubble Express” comes barreling toward you is a very painful way to show your disdain for macro concepts and a blind devotion to your central skill of stock picking. The really major bubbles will wash away big slices of even the best Graham and Dodd portfolios. Ignoring them is not a good idea.
~~~
For those interested, I did an interview with Tanya Benedicto, a new and upcoming blogger from Forbes, from The Breakers in Palm Beach. She reminds me of my twins. Other than calling me MR. Mauldin, it was a good interview and a short five minutes on what has me disconcerted this week. Here is the link: http://blogs.forbes.com/tanyabenedicto/2011/01/30/thoughts-from-the-frontline/.
Enjoy your week. I am off to Vegas and then Thailand, assuming the predicted ice storm allows me to get out of Dallas. And figure out a time to write an e-letter. And for fun, I offer a picture of something David Walker handed me as we were getting ready to do our panel last Thursday.
Your really excited about Thailand analyst,
John F. Mauldin
johnmauldin@investorsinsight.com
John Mauldin, Best-Selling author and recognized financial expert, is also editor of the free Thoughts From the Frontline that goes to over 1 million readers each week. For more information on John or his FREE weekly economic letter go to: http://www.frontlinethoughts.com/learnmore
To subscribe to John Mauldin's E-Letter please click here:http://www.frontlinethoughts.com/subscribe.asp
Copyright 2011 John Mauldin. All Rights Reserved
Note: John Mauldin is the President of Millennium Wave Advisors, LLC (MWA), which is an investment advisory firm registered with multiple states. John Mauldin is a registered representative of Millennium Wave Securities, LLC, (MWS), an FINRA registered broker-dealer. MWS is also a Commodity Pool Operator (CPO) and a Commodity Trading Advisor (CTA) registered with the CFTC, as well as an Introducing Broker (IB). Millennium Wave Investments is a dba of MWA LLC and MWS LLC. Millennium Wave Investments cooperates in the consulting on and marketing of private investment offerings with other independent firms such as Altegris Investments; Absolute Return Partners, LLP; Plexus Asset Management; Fynn Capital; and Nicola Wealth Management. Funds recommended by Mauldin may pay a portion of their fees to these independent firms, who will share 1/3 of those fees with MWS and thus with Mauldin. Any views expressed herein are provided for information purposes only and should not be construed in any way as an offer, an endorsement, or inducement to invest with any CTA, fund, or program mentioned here or elsewhere. Before seeking any advisor's services or making an investment in a fund, investors must read and examine thoroughly the respective disclosure document or offering memorandum. Since these firms and Mauldin receive fees from the funds they recommend/market, they only recommend/market products with which they have been able to negotiate fee arrangements.
Opinions expressed in these reports may change without prior notice. John Mauldin and/or the staffs at Millennium Wave Advisors, LLC and InvestorsInsight Publishing, Inc. ("InvestorsInsight") may or may not have investments in any funds cited above.
Disclaimer PAST RESULTS ARE NOT INDICATIVE OF FUTURE RESULTS. THERE IS RISK OF LOSS AS WELL AS THE OPPORTUNITY FOR GAIN WHEN INVESTING IN MANAGED FUNDS. WHEN CONSIDERING ALTERNATIVE INVESTMENTS, INCLUDING HEDGE FUNDS, YOU SHOULD CONSIDER VARIOUS RISKS INCLUDING THE FACT THAT SOME PRODUCTS: OFTEN ENGAGE IN LEVERAGING AND OTHER SPECULATIVE INVESTMENT PRACTICES THAT MAY INCREASE THE RISK OF INVESTMENT LOSS, CAN BE ILLIQUID, ARE NOT REQUIRED TO PROVIDE PERIODIC PRICING OR VALUATION INFORMATION TO INVESTORS, MAY INVOLVE COMPLEX TAX STRUCTURES AND DELAYS IN DISTRIBUTING IMPORTANT TAX INFORMATION, ARE NOT SUBJECT TO THE SAME REGULATORY REQUIREMENTS AS MUTUAL FUNDS, OFTEN CHARGE HIGH FEES, AND IN MANY CASES THE UNDERLYING INVESTMENTS ARE NOT TRANSPARENT AND ARE KNOWN ONLY TO THE INVESTMENT MANAGER.
John Mauldin Archive |
© 2005-2022 http://www.MarketOracle.co.uk - The Market Oracle is a FREE Daily Financial Markets Analysis & Forecasting online publication.