


U.S. Housing Bear Market Resumes in 2011
Housing-Market / US Housing Feb 02, 2011 - 04:07 AM GMTBy: Clif_Droke

 An oft-repeated maxim is that real estate is one of the best long-term investments. For the better part of the last 60 years or so this certainly held true. In a typical “long wave” or 60-year Kress cycle, real estate benefits almost from the start of the inflationary leg of the long wave and prices tend to increase even after the 60-year cycle of inflation/deflation peaks, and real estate prices can continue to increase in the ensuing dis-inflationary years of the cycle. It’s mainly during the final “hard down” part of the cycle -- which is defined as the final 8-12% of the cycle -- that the real estate market struggles under the weight of deflation.
Real estate hates hyper-deflation and the final 5-7 years of the 60-year cycle are always hyper-deflationary. In the current 60-year cycle which began in 1954, the final “hard down” phase began in 2007 -- right on schedule as this was 7 years from the cycle’s scheduled bottom in 2014. The real estate boom also had its end around that time and since then housing prices have struggled in the ensuing deflationary “winter” phase.
The bear market in real estate which began over four years ago has had a devastating impact on mortgage holders. Hyper deflation is never kind to debt holders but it’s doubly damaging when the value of one’s home is declining while the relative cost of the debt is rising. This exacts a negative toll on psychology, which in turn effects all aspects of consumer spending. The real estate bear market is a prime indication that deflation is the dominant theme in the U.S. economy and will be for at least a few more years.
One thing that has made it difficult for investors to discern the pernicious influence of deflation is the government’s attempts at artificially creating asset price inflation. Government stimulus money was applied liberally to the real estate market in 2009 and this had the temporary effect of boosting the real estate market ever so slightly. When government support was withdrawn in mid 2010, the market began rolling over once again, as you can see in the Case-Shiller 20-City Home Price Index below.
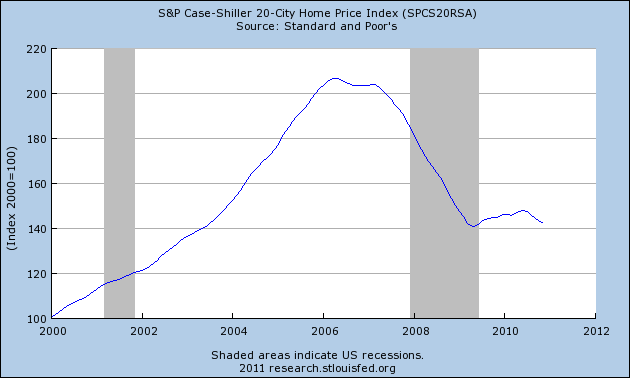
Since starting downward again last July, the Case-Shiller index has slid for four consecutive months. This marks the first time since early 2009 during the worst of the housing crash that we’ve seen this many successive monthly declines in the index.
In the latest issue of his Campbell Real Estate Timing Letter (3525 Del Mar Heights Road, #634, San Diego, CA 92130), real estate expert Robert Campbell observes that the SA-20 City index is now down by nearly 1% since October 2009, which is the first time since January 2010 that the year-over-year reading has turned negative. Campbell believes this is sufficient evidence that a major trend change in the U.S. housing market has likely occurred and that prices are now rolling over to the downside.
Adding pressure against this negative trend is a glue of unsold houses which still overhangs the market. The inventory of existing homes on the market was most recently reported at 3.71 million, according to the National Association of Realtors. Campbell points out that this represents a 10.5 month supply and is 80% above the historic norm of 5 to 6 months.
Campbell, who correctly predicted the top of the real estate bubble, has been talking about the “shadow inventory” of roughly 7 million homes that are either in foreclosure, seriously delinquent, or owned by lenders that will be hitting the re-sale market soon.
According to data provided by Lender Processing Services, a majority of the delinquencies are in 25 major metropolitan areas with Los Angeles, New York, Chicago and Miami leading the delinquency list. Says Campbell, “Anyone who thinks that prices have bottomed in the Miami, New York, Los Angeles, or Chicago metro areas had better take a good, hard look at these statistics.”
Indeed, home foreclosures continued apace in 2010. Over one million homes were foreclosed in 2010 and RealtyTrac Inc. has predicted a further 1.2 million homes will be repossessed in 2011. A key factor that could exacerbate this trend is the 6-year cycle peak scheduled for later this year. The previous 6-year cycle peak in 2005 coincided with the peak of the real estate bull market and the commencement of the housing crash.
We’ll soon be entering a dangerous phase of the long-term Kress cycles once the 6-year cycle peaks later this year. The 6-year cycle is the only yearly cycle of consequence that’s helping to stabilize prices. Once the 6-year cycle peaks in a few months, the major cycles within the Kress 60-year series will all be hard down until 2014. As such, this isn’t the time to be “bottom fishing” for real estate investment opportunities. The upcoming 60-year cycle bottom in 2014 should bring better opportunities for buying low.
Gold ETF
Let’s take a look at the gold market. The SPDR Gold Trust ETF (GLD), our favorite gold proxy, confirmed an immediate-term sell signal in relation to its immediate-term trend line in December. From there, GLD went on to violate its 90-day moving average. As we talked about in the Jan. 21 report, “This is a key intermediate-term trend line and whenever the 90-day MA is violated, the dominant longer-term 30-week (150-day MA) is usually the next in the key interim moving average series to be tested. That means we can probably expect to see GLD testing the 127.50-128.00 area soon.” GLD ended up precisely on top of its 150-day moving average as you can see in the following chart.
GLD has since built support above the 150-day MA and has commenced an overdue relief rally. An interesting parallel to gold’s (and GLD’s) recent corrective decline can be found exactly one year ago. The 2-month correction that began in December 2009 and continued until early February 2010 found support precisely atop the 30-week/150-day moving average as you can see in the historical chart below. So far the parallel correction from a year ago is holding up.
Another parallel from last year’s correction is that the gold stock internal momentum indicator was in steady decline until around late February and although GLD and the gold stocks bottomed in early February, they didn’t actually commence a new bull market until several weeks later. As you can see in the above chart from last year, GLD needed a few weeks after touching down and establishing support above the 150-day moving average before it actually got going again on the upside. The same will most likely hold true this time, i.e. patience is required here.
America’s Housing Bubble
The collapse of the real estate bubble was for all intents and purposes the death of the American Dream. It washed away the illusions associated with home ownership for millions. It ushered in the worst financial crisis and economic downturn since the Great Depression. Even worse, the housing market is still depressed years after the calamitous event and shows no signs of bottoming. Many home owners wonder if they’ll ever see the value of their homes increase. For many, the American Dream has turned into an American Nightmare.
In 2005 I published the book, “America’s Housing Bubble: The Outlook for 2006-2012,” which predicted the real estate collapse and the many changes it would bring to the economic landscape. It provides a projected time frame for the next real estate market bottom. It also provides tips for surviving and even profiting from the crisis and forecasts its eventual recovery. The information contained in this book is just as valid now as it was in 2005.
The book is now available for sale at: http://www.clifdroke.com/books/housingbubble.mgi
By Clif Droke
www.clifdroke.com
Clif Droke is the editor of the daily Gold & Silver Stock Report. Published daily since 2002, the report provides forecasts and analysis of the leading gold, silver, uranium and energy stocks from a short-term technical standpoint. He is also the author of numerous books, including 'How to Read Chart Patterns for Greater Profits.' For more information visit www.clifdroke.com
Clif Droke Archive |
© 2005-2022 http://www.MarketOracle.co.uk - The Market Oracle is a FREE Daily Financial Markets Analysis & Forecasting online publication.