


Phony Official Inflation Statistics Produced by Dirty Rotten Scoundrels
Economics / Inflation Feb 09, 2011 - 05:49 AM GMTBy: Rob_Kirby

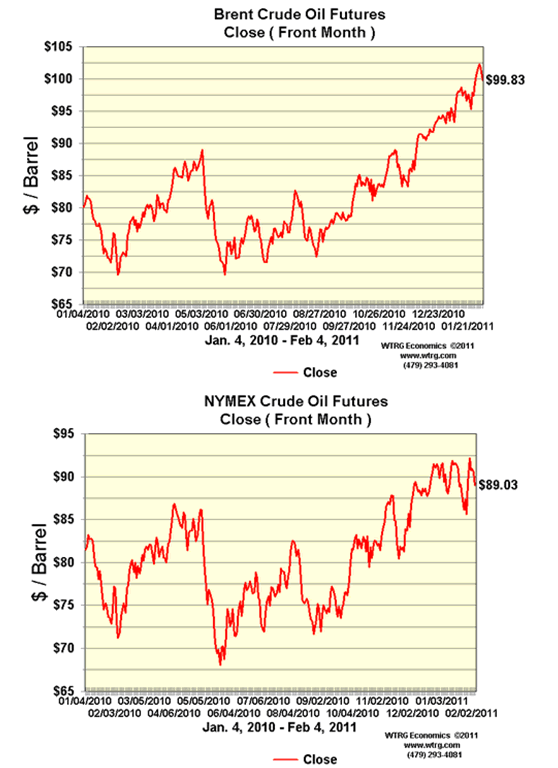
 The purpose of this paper is to draw particular attention to the recent disparity in crude oil prices – namely the difference between two benchmarks - West Texas Intermediate [WTI] and Brent [North Sea] Crude. Historically the price of WTI trades at a premium to lesser quality Brent North Sea Crude. This paper lays out the case that the extreme, existing, observable price discrepancies is likely the result of engineered and arbitrary market manipulations – to be discussed below. Such arbitrary price manipulations in the oil markets impact negatively on the oil exporting economies and show favor to oil importing economies.
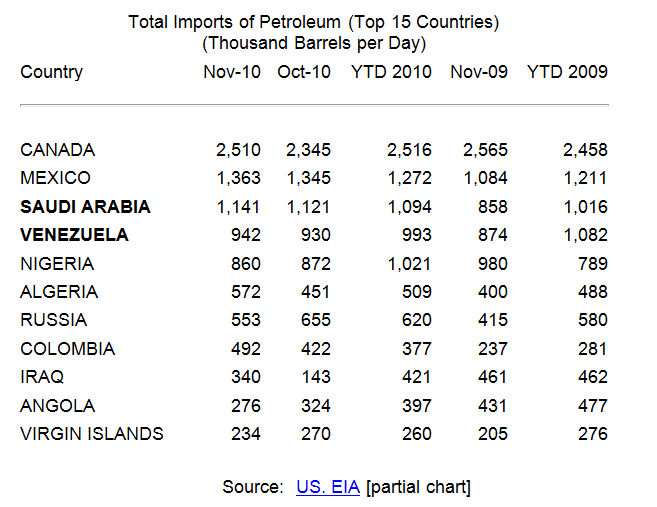
The following chart depicts the most recent data available of Total imports of crude by the U.S.:
Within the past two years, a number of the worlds’ oil producers/exporters have dropped the WTI benchmark for sales of crude oil to America and others:
Tuesday, November 24, 2009
Earlier this month, the world’s largest oil producer set the table for a move away from traditional light, sweet crude oil.
Saudi Aramco, the state-owned company of Saudi Arabia has decided to drop West Texas Intermediate (NYMEX: WTI) as the basis for pricing its oil sold to the U.S. market. The Saudis priced off WTI for 15 years.
Why? Well, quite simply, WTI crude oil is dangerously volatile – as evidenced by the drop from $150 per barrel to $30 crude over the past year. [Ed. Note: We suspect the real reason for dropping the WTI benchmark is for reasons that are not politically correct to repeat, read on, below]
In its place, Saudi Aramco will start using the Argus Sour Crude Index (ASCI), which measures heavier oil with higher sulfur content. Traditionally, heavy, sour crude is cheaper than WTI. Heavy crude requires extra processing at the refinery to remove impurities, which is why it’s discounted.
So what? Why does it matter that one company is changing its benchmark for oil from January 2010? Let me explain…
Current Benchmarks at Risk
The primary benchmarks for crude oil are…
- WTI, which measures onshore light, sweet crude in Texas.
- Brent, which measures light, sweet crude on the north shore of Europe.
- Omani crude on the Dubai Mercantile Exchange (DME). …
……After Saudi Aramco announcement, Venezuelan president Hugo Chavez said his country would follow its lead in using ASCI as the benchmark crude import to the United States.
And there is also speculation that many Canadian producers, particularly those planning to use TransCanada’s Keystone Pipeline, will do the same thing. [Editors note: Canada remains benchmarked to WTI or derivatives thereof for crude exports]
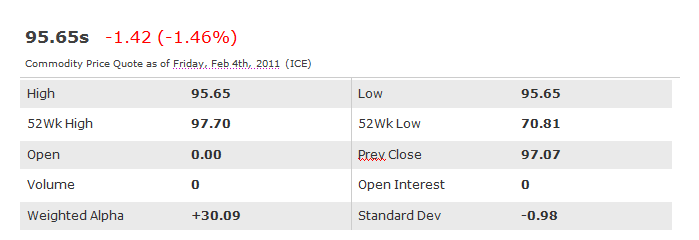
Argus sour crude is an INFERIOR PRODUCT TO WTI and normally sells at a discount [WTI is currently trading at 89.00 – arguably, a difference of close to 7.00 in the wrong direction]. Here is its current price:
ICE Asci Crude March 2011 (ZUH11)
Argus Crude futures and Brent North Sea Crude futures both trade on the Intercontinental Exchange [ICE] – which is London based and not nearly as American biased / influenced as West Texas Intermediate [WTI] which is the underlying commodity of New York Mercantile Exchange's oil futures contracts. Essentially, the difference between the two pricing regimes is that ICE is European [World] centric while the WTI is more reflective of “made in America pricing”.
CONCLUSIONS:
Saudi Arabia and Venezuela are predominantly selling the U.S. lower grade SOUR CRUDE – at the aforementioned elevated price which is a stiff premium to WTI. By extension, they are likely selling their higher grade sweet crude to OTHER NATIONS [like China, Europe] at the MUCH HIGHER Brent Benchmark price.
Free or ‘Fixed’ Markets?
The output of Canada’s oil industry is being sold at a discounted benchmark price relative to what other major oil producers are receiving. This – at least in part - explains why Canada’s Current Account [Trade] surplus has narrowed so much [and gone into deficit] in recent years.
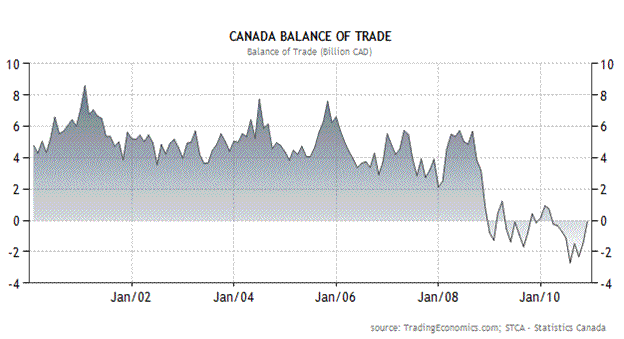
We suspect this is the REAL REASON why many of the world’s oil producers went off the WTI benchmark – it appears to be “arbitrarily discounted”. Canada, and perhaps Mexico, by using this discounted price - are receiving LESS. This is compromising their trade balances and hence their national finances. Remember folks, TRADE DEFICITS DESTROYED AMERICA as much or more than their budget deficit. Canada today is [conservatively] receiving $10.00 per barrel LESS than it should be. 10.00 per barrel x 2.5 million per day = 25 mill per day or 750 million per month or 9 billion / yr. – just for crude oil.
Now consider: that despite being a net energy exporter, Canada also imports large amounts of energy products:
Domestic crude accounts for only about 45% of Canada's oil consumption. Imports represented the remaining 55%, mostly coming from either North Sea countries or the Middle East. Imported oil feeds refineries mostly in Eastern Canada.
In fact, Canada imports close to 1.1 million barrels of oil per day:
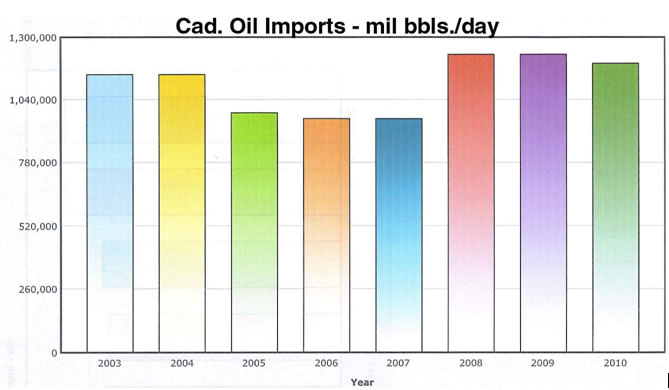
source: C.I.A.
So, Canada’s trade picture is actually getting a “double whammy” - Exporting CHEAP, UNDERPRICED HIGH-GRADE crude to the U.S. and Importing more EXPENSIVE LESSER-GRADES from Europe and the Middle East [to the tune of losing an additional 10 bucks per barrel on another 1.1 million barrels per day]. In economic parlance this is called “buying high” and “selling low” or a great recipe for ‘going broke’. No wonder Canada’s trade picture has soured so much.
Now stop and consider that the price collapse of Natural Gas from the 15 Dollar level [13.00+ level in North America] was concurrent with that of crude oil – and the European price of Nat. Gas is now in 10.00+ region today versus 4 bucks and change in North America:
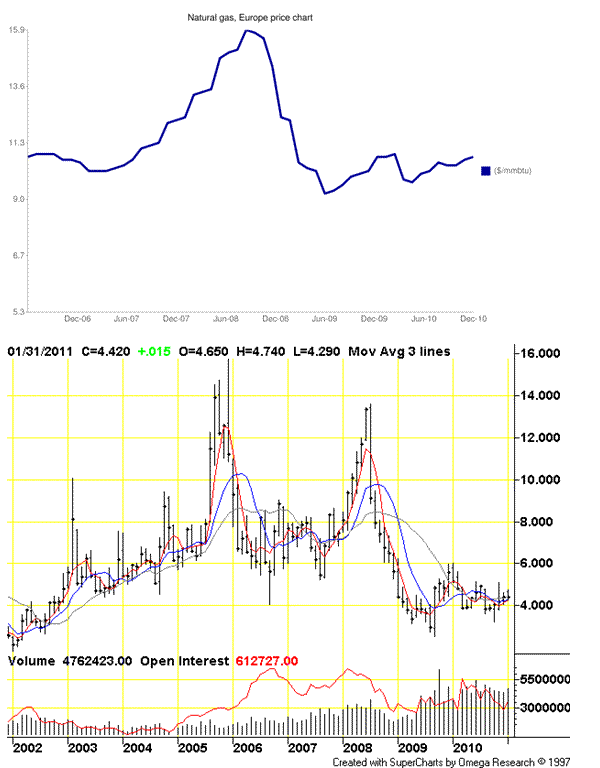
The notion that Nat. Gas is purely a “regional market” and North America is ‘awash’ in natural gas to explain the price disparity between North American and European product is “disingenuous gibberish”.
The world's largest proven gas reserves are located in Russia, with 4.757×10¹³ m³ (1.68×10¹⁵ cubic feet). With the Gazprom company, Russia is frequently the world's largest natural gas extractor. Major proven resources (in billion cubic meters) are world 175,400 (2006), Russia 47,570 (2006), Iran 26,370 (2006), Qatar 25,790 (2007), Saudi Arabia 6,568 (2006) and United Arab Emirates 5,823 (2006). It is estimated that there are also about 900 trillion cubic meters of "unconventional" gas such as shale gas, of which 180 trillion may be recoverable.[4]
The natural gas price in North America is determined by the “paper trade” in the same way that precious metals prices are determined by the sales of a hundred ounces for every physical ounce in inventory.
More specifically, the price of Nat. Gas in North America has been determined on the trading desk of J.P. Morgan Chase since Jan. 2006 when J.P. Morgan entered the Nat. Gas futures trading arena to ‘exterminate” and take the other side of their ‘serial long’ customer – Amaranth’s trades. This is extensively documented in a 2007 treatise titled, Derivatives Disaster: Deriving The Truth.
Notice the demarcation point [from mid-2008] when America began “rigging” energy prices in earnest – something documented back in early 2009 in a treatise titled, Oh Yes They Did!
The key point explained in Oh Yes They Did! was the fact that the U.S. Dept. of Energy [DOE] acknowledged in their 2008 annual report that crude was diverted from the Strategic Petroleum Reserve [SPR] in June 2008 due to high prices:
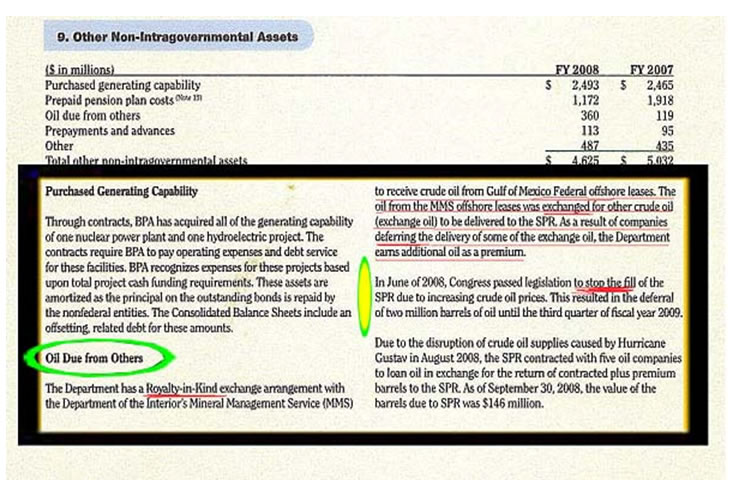
source: 2008 U.S. Dept. of Energy Annual Report
Caught in a Lie?
Interestingly and in conflict to this June 2008 DOE acknowledgement was this crass attempt at revisionism when citing these same crude oil movements in their 2009 Annual Report for the Strategic Petroleum Reserve – where they stated [pdf. pg. 58] that oil was not diverted until Sept. 2008 due to HURRICANES:
Oil Deliveries
When Hurricanes Gustav and Ike struck the Gulf Coast in September 2008, they impacted oil production, refining, and distribution operations that led to shortages of both crude oil and refined products. The Secretary of Energy utilized the authority of section 161(g)(1) of the Energy Policy and Conservation Act (EPCA) (42 U.S.C. 6241(g)(1)) to authorize the test of Strategic Petroleum Reserve response capabilities through limited test exchange contracts that would release emergency crude oil to refiners and help mitigate the severe regional supply disruption.
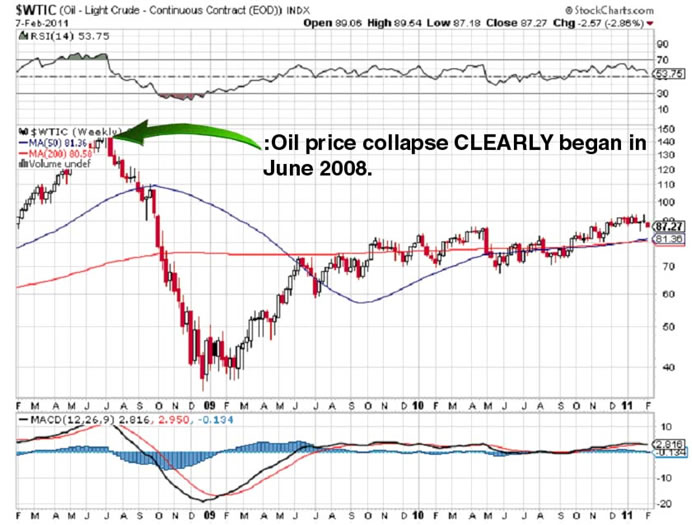
Take a look at when the price of crude COLLAPSED in 2008 and ask yourself which of the above explanations makes more sense:
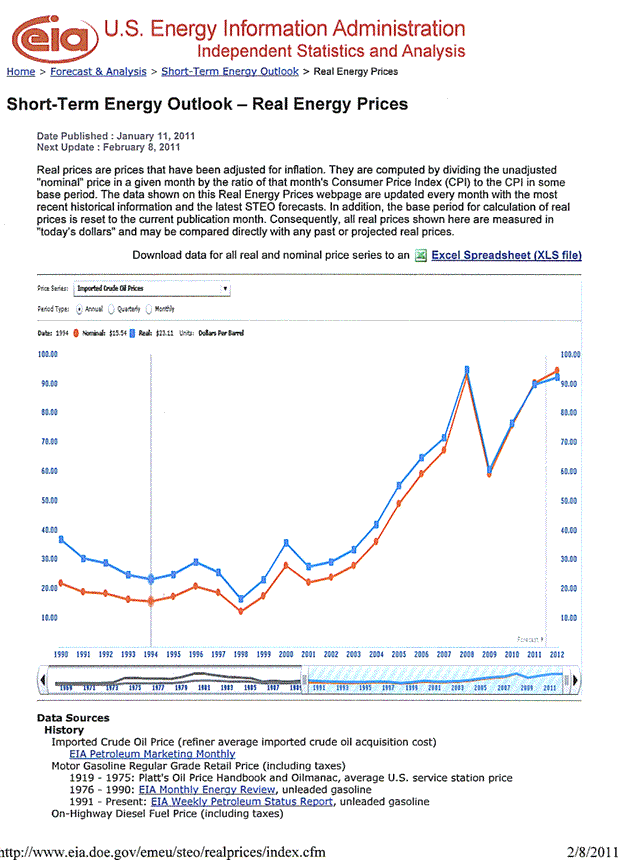
If the sad tale told above is not enough – one should consider that the U.S. Agencies responsible for tabulating “official inflation rates” – like the Producer Price Index – they use the “manipulated and depressed” WTI price in their calculation as evidenced by the EIA’s admissions here. We know they are using WTI because their reference chart does not reflect recent prices of ASCI [sour crude] or Brent Crude – the real benchmark prices being paid:
This only lends more credence to the work of those like John Williams of Shadowstats.com who point out how corrupt and misleading official inflation data really is.
This is the true state of our capital markets, folks.
What a disgrace.
The balance of this article is for subscribers only. Subscribe here.
By Rob Kirby
http://www.kirbyanalytics.com/
Rob Kirby is proprietor of Kirbyanalytics.com and sales agent for Bullion Custodial Services. Subscribers to the Kirbyanalytics newsletter can look forward to a weekend publication analyzing many recent global geo-political events and more. Subscribe to Kirbyanalytics news letter here. Buy physical gold, silver or platinum bullion here.
Copyright © 2010 Rob Kirby - All rights reserved.
Disclaimer: The above is a matter of opinion provided for general information purposes only and is not intended as investment advice. Information and analysis above are derived from sources and utilising methods believed to be reliable, but we cannot accept responsibility for any trading losses you may incur as a result of this analysis. Individuals should consult with their personal financial advisors before engaging in any trading activities.
Rob Kirby Archive |
© 2005-2022 http://www.MarketOracle.co.uk - The Market Oracle is a FREE Daily Financial Markets Analysis & Forecasting online publication.