


U.S. Treasury Yield Curve Starts to Decline
Interest-Rates / US Interest Rates Feb 12, 2011 - 02:49 AM GMTBy: Donald_W_Dony

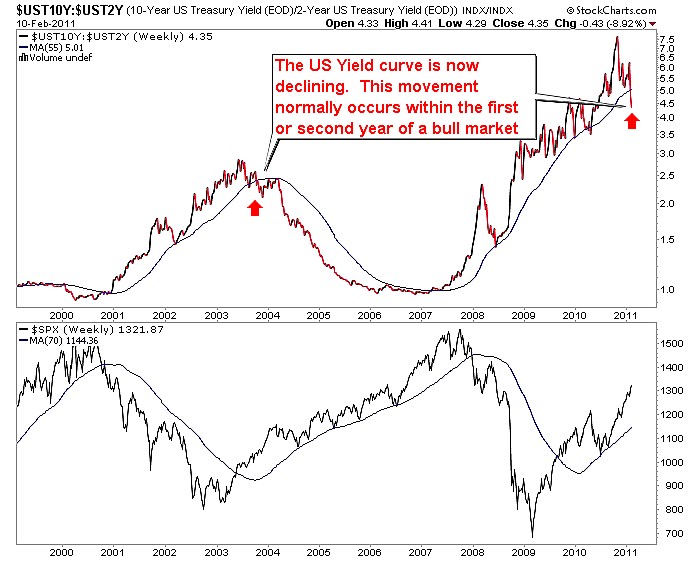
After three years of progressive climbing, the U.S. Yield curve is now starting to decline. Yield curves start to fall when short term bond yields rise at a faster pace then long bond yields. This event typically occurs in the first or second year of a bull market.
The economic factors that drive this movement (declining yield curve) can vary from one cycle to the next but the implications are normally the same. They represent growing economic strength.
During the last bull market (2002 to 2007), the yield curve started to descend in 2003 and finally flattened in late 2006. This pattern mirrored the upward path of the S&P 500, the U.S economy and their eventual crest in 2007.
The progressive downward trend of the yield curve, which is just beginning, signifies renewed growth in the U.S. It also highlights that short term interest rates are going to rise in the very near future.
Bottom line: The start of a decline in the yield curve indicates persistent strength in the U.S. economy. As this event occurs in the early to mid-portion of a bull market, ongoing upward pressure can be expected for the S&P 500 into 2011 and 2012.
Investment approach: The falling yield curve is another positive sign for the U.S. economy and illustrates that the recovery process is building. For example, GDP, in the last quarter, reached 3.10% which is near the 60-year average of 3.28%. Investors can use the curve as a reliable guide to the stock market and also as a leading indicator to the next equity peak.
Industry groups that normally outperform during this phase of the economy cycle are materials, housing-related companies, construction, chemicals and retail. Investors may wish to focus on these sectors in 2011.
Your comments are always welcomed.
By Donald W. Dony, FCSI, MFTA
www.technicalspeculator.com
COPYRIGHT © 2011 Donald W. Dony
Donald W. Dony, FCSI, MFTA has been in the investment profession for over 20 years, first as a stock broker in the mid 1980's and then as the principal of D. W. Dony and Associates Inc., a financial consulting firm to present. He is the editor and publisher of the Technical Speculator, a monthly international investment newsletter, which specializes in major world equity markets, currencies, bonds and interest rates as well as the precious metals markets.
Donald is also an instructor for the Canadian Securities Institute (CSI). He is often called upon to design technical analysis training programs and to provide teaching to industry professionals on technical analysis at many of Canada's leading brokerage firms. He is a respected specialist in the area of intermarket and cycle analysis and a frequent speaker at investment conferences.
Mr. Dony is a member of the Canadian Society of Technical Analysts (CSTA) and the International Federation of Technical Analysts (IFTA).
Donald W. Dony Archive |
© 2005-2022 http://www.MarketOracle.co.uk - The Market Oracle is a FREE Daily Financial Markets Analysis & Forecasting online publication.
Comments
|
12 Feb 11, 06:29 |
ponzi
the ponzi scheme lives |