


Stock Market Up, Up and Away, Elliott Wave Analysis for Week Starting 21st Feb
Stock-Markets / Stock Markets 2011 Feb 19, 2011 - 09:24 AM GMTBy: Tony_Caldaro

 For the eleventh week in a row the SPX made new bull market highs this week. Statistically that is quite a run as this seven month uptrend continues to extend. Economic reports were plentiful and positive. Thirteen were positive or improving, four negative or weakening, and one flat. The negatives were declines in industrial production, building permits and the M1-multiplier, plus an increase in weekly jobless claims. The NAHB housing index remains flat and bouncing along the bottom. On the positive side; the PPI/CPI were positive, along with import/export prices, retail sales, the leading indicators. On the improve were the NY/Philly FED, business inventories, capacity utilization, the monetary base and the WLEI.
For the week the SPX/DOW were +1.0%, and the NDX/NAZ were +0.75%. Asian markets gained 2.4%, European markets added 1.2%, the Commodity equity group rallied 1.8%, and the DJ World index rose 1.8% as well. US Bonds were +0.5%, Crude added 1.6%, Gold rallied 2.3% (Silver was +8.8%), and the USD declined 1.1%. With the FOMC minutes and Options expiration now behind us we look ahead this week to housing, consumer confidence/sentiment and friday’s second estimate on Q4 GDP. Monday is a national holiday in the US: Presidents Day.
LONG TERM: bull market
This week we will take another look at the OEW characteristics of a typical bull market. Keep in mind a bull market is not confirmed by OEW until there is a long term uptrend. We have been in one for over a year now. Gold, in contrast, has been in a confirmed long term uptrend since 2001.
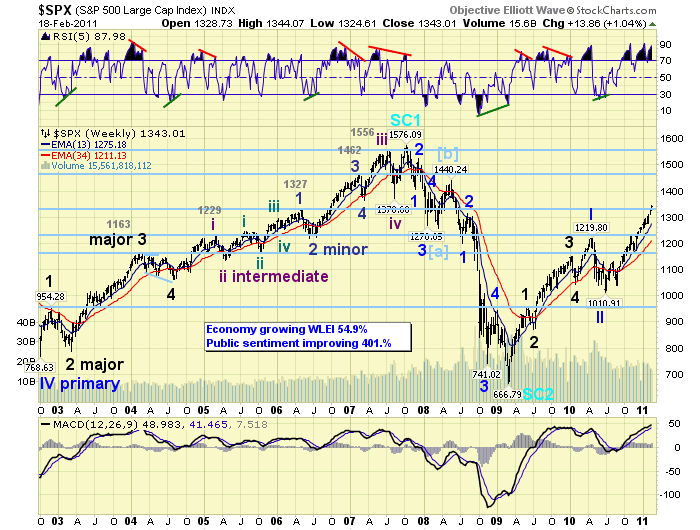
When we review the SPX weekly chart above, which displays a bear market sandwiched by two bull markets, we observe several technical characteristics. First, during the 2002-2007 and the 2009 bull markets the RSI spends most of its time in an overbought condition and only gets slightly oversold during corrections. Inversely, during the 2007-2009 bear market the RSI spends most of its time in an oversold condition and during rallies gets only slightly overbought. Second, during bull markets the MACD generally remains above neutral during the entire bull market. Then during a bear market it remains below neutral. Lastly, during bull markets the OEW wave patterns unfold in impulse waves (five waves up). While during bear markets they unfold in corrective waves (three waves down). The technical evidence clearly suggests we have been in a bull market since March 2009. This is certainly one picture that is worth a thousand words.
MEDIUM TERM: uptrend high @ SPX 1344
In September we published the following bull market projection based upon the characteristics the stock market had displayed up until that point in time. The market at the time was at SPX 1149: http://caldaro.wordpress.com/.... In this tentative projection we estimated a six month uptrend from July10 to Jan11 topping around the OEW 1313 pivot. The market hit that pivot range on February first. But the uptrend displays no signs of reversing yet and we are clearly into its seventh month.
Also noted in the report was the tendency for the uptrends to unfold in three month intervals, or their multiples: Mar-Jun, July-Jan and early Feb to late April. The next window for a potential top, using this bull market characteristic, would be April: nine months.
In regard to price. Since our first price objective of the OEW 1313 pivot has already been met. And, this uptrend continues to extend. Our second price objective of the OEW 1440 pivot is next. Between friday’s close at SPX 1343 and the 1440 pivot is nearly another 100 SPX points (7.2%) and four OEW pivots: 1363, 1372, 1386 and 1440. Notice the large gap between the 1386 and 1440 pivots. This gap is similar to the current pivot gap between 1313 and 1363 pivots.
Are we projecting SPX 1440 by April? Only if the SPX clears the 1386 pivot and remains in this uptrend. In fact, it is possible that this uptrend can extend all the way out until July, twelve months, and then hit the third price objective at the OEW 1552 pivot. If this did occur it would probably be all of Primary wave III, not just Major wave 1. All the anticipated Major waves would have unfolded within the context of one uptrend. Rare, but it did occur once before in the early 1950′s. For now, lets take this bull market one OEW pivot at a time.
SHORT TERM
Support for the SPX remains at 1313 and then 1303, with resistance at 1363 and then 1372. Short term momentum ended the week just above neutral. Tracking an extending uptrend, such as this, is quite testing for even the best technicians. We’re quite comfortable with the labeling of the four Intermediate waves noted in the chart above: wave i SPX1129, wave ii SPX 1040, wave iii SPX 1227 and wave iv SPX 1173. From that November Intermediate wave four SPX 1173 low, Intermediate wave five looked like it would complete at the OEW 1303 pivot in late January. But this uptrend was not done yet, and after the largest pullback since that low the market turned right around and the uptrend started to extend.
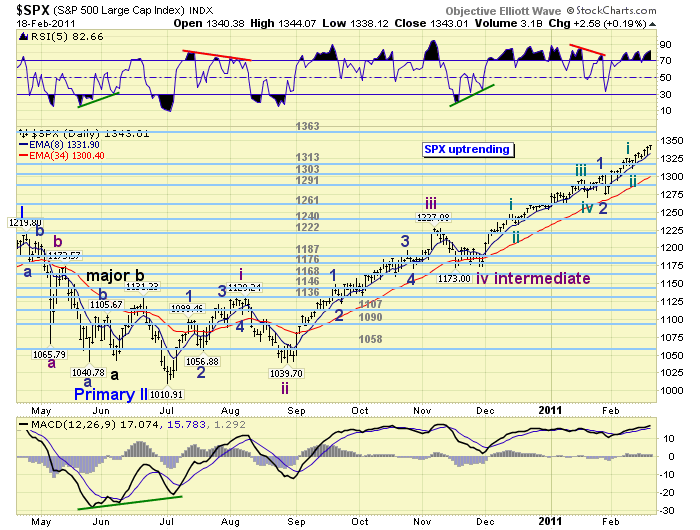
Currently the most probable wave count would suggest that Intermediate wave five is extending, and it is currently in Minor wave 3 of that extension. This suggests we still have a Minor waves 4 and 5 ahead of us before the uptrend ends. Minor wave 3 should run into resistance at the OEW 1363 pivot. Which also matches a cluster of fibonacci relationships (SPX 1360-1364) noted in last weekend’s report.
We are also carrying one other potential SPX wave count, which is labeled on the NDX daily chart. We will be moving that count over to the DOW daily chart shortly. The NDX, btw, has already exceeded its 2007 high by 7.4%, and the NAZ is less than 1% below its 2007 high. The very low probability alternate bearish count, labeled on the NAZ chart, will be eliminated. Best to your trading!
FOREIGN MARKETS
Asian markets were all higher on the week for a 2.4% net gain. India’s BSE and Hong Kong’s HSI may have both bottomed in their downtrends, India with a positive divergence, and are both rallying. The other three indices are uptrending.
European markets were also all higher on the week for a 1.2% net gain. All five european indices are in uptrends.
The Commodity equity group was mixed on the week for a net gain of 1.8%. Brazil’s BVSP looks very much like India’s BSE, with a downtrend low on a positive divergence and rallying. The other two indices are in uptrends.
The DJ World index remains in an uptrend and gained 1.8% on the week.
COMMODITIES: the bull market continues
Bond prices remain in a downtrend but bounced off of recents lows to gain 0.5% on the week. 10YR yields nearly hit 3.75% recently, their highest level since the spring of 2010.
Crude is still in an OEW uptrend, despite the recent weakness, and gained 1.6% on the week.
Gold continues to rally from its recent downtrend low at $1308. It gained 2.3% on the week. Uptrending Silver gained 8.8% for the week and made new bull market highs.
The downtrending USD lost 1.1% on the week. It has remained in a DXY 76-81 trading range since November.
NEXT WEEK
Monday is a national holiday. Tuesday kicks off the economic week with the always interesting Case-Shiller housing report. Identifying the end of this bear market, when it occurs, will impact the largest part of the population. Also on tuesday we have the Consumer confidence reading. On wednesday Existing home sales will be reported. Then on thursday, weekly Jobless claims, Durable goods, the FHFA housing index, and New home sales. On friday Q4 GDP and the Consumer sentiment reading. The FED has only one thing on their agenda. On friday vice-chairman Yellen gives a speech in NYC. Best to your extended weekend!
CHARTS: http://stockcharts.com/...
http://caldaroew.spaces.live.com
After about 40 years of investing in the markets one learns that the markets are constantly changing, not only in price, but in what drives the markets. In the 1960s, the Nifty Fifty were the leaders of the stock market. In the 1970s, stock selection using Technical Analysis was important, as the market stayed with a trading range for the entire decade. In the 1980s, the market finally broke out of it doldrums, as the DOW broke through 1100 in 1982, and launched the greatest bull market on record.
Sharing is an important aspect of a life. Over 100 people have joined our group, from all walks of life, covering twenty three countries across the globe. It's been the most fun I have ever had in the market. Sharing uncommon knowledge, with investors. In hope of aiding them in finding their financial independence.
Copyright © 2011 Tony Caldaro - All Rights Reserved Disclaimer: The above is a matter of opinion provided for general information purposes only and is not intended as investment advice. Information and analysis above are derived from sources and utilising methods believed to be reliable, but we cannot accept responsibility for any losses you may incur as a result of this analysis. Individuals should consult with their personal financial advisors.
© 2005-2022 http://www.MarketOracle.co.uk - The Market Oracle is a FREE Daily Financial Markets Analysis & Forecasting online publication.