Has Crude Oil Spiking Kicked-Off a New Stocks Bear Market?
Stock-Markets / Stock Markets 2011 Mar 03, 2011 - 02:17 AM GMTBy: Chris_Ciovacco
 Today, we cover specific strategies and tactics we may employ over the coming weeks with respect to our holdings, cash, the Fed, the outlook for stocks, oil prices, and key market levels. The recent spike in oil prices has many wondering if it is “déjà vu all over again”. In July 2008, oil prices surged to over $140 per barrel with the S&P 500 trading at 1,240. As oil came back to earth over the coming months, the S&P 500 did not find buyers until hitting 666 intraday in March 2009.
While the current rapid ascent in oil prices is troubling, we must keep in mind the July 2008 peak in oil occurred in the early stages of a once-in-a-generation financial crisis. Oil prices had plenty of help ushering in a bear market in 2008, including an off-the-charts bubble in both housing and lending.
There are three major factors that tell us the odds we are in the early stages of a new bear market are not all that great:
- Ben Bernanke is in control of the printing presses.
- The economy is not teetering on the brink of a recession.
- Stocks have significant technical support in relatively close proximity.
It is nearly impossible to effectively manage money in today’s world if you do not understand the objectives of quantitative easing (QE) and how it works in the real world. We have covered this topic in detail in previous articles, but we can summarize it as follows:
Quantitative easing creates money out of thin air, floods the global financial system with cash to re-inflate asset prices, which in turn helps heal sick balance sheets in an effort to rekindle the positive economic spark provided by the wealth effect.
According to a Bloomberg article, the Fed has no plans to make a drastic shift in policy:
Federal Reserve Chairman Ben S. Bernanke signaled he’s in no rush to tighten credit after the Fed finishes an expansion of record monetary stimulus, seeing little inflation risk and still-slow job growth. A surge in the prices of oil and other commodities probably won’t generate a lasting rise in inflation, Bernanke told lawmakers yesterday in semiannual testimony on monetary policy. A “sustained period of stronger job creation” is needed to ensure a solid recovery, and the Fed’s benchmark rate will stay low for an “extended period,” he said.
If you believe a new bear market has already started, then you must also believe we are on the cusp of negative GDP growth. Looking back at both the economy and stock market, history tells us bearish activity and negative economic growth went hand-in-hand in the early 1990s, early 2000s, and again in 2008. The National Association for Business Economics (NABE) February 2011 consensus forecast of 47 economists calls for economic growth of 3.3% in 2011 and 3.4% in 2012, which is nowhere near bear market territory. Obviously, forecasters have been wrong in the past, but recent economic data has remained in-line with positive economic outcomes.
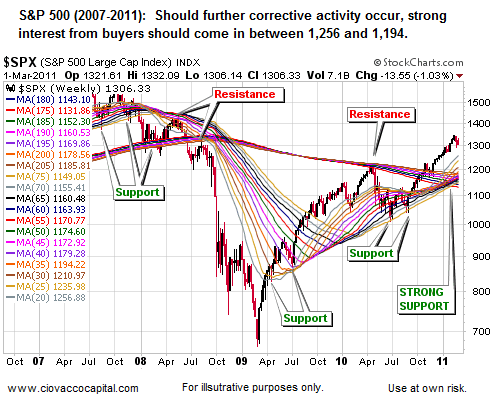
In addition to the Fed’s printing press, and positive economic projections, the S&P 500 also has significant support between 1,256 and 1,194. Below is an updated version of a chart that we described in detail on February 10. The main takeaway is simple - the intersection of the two moving average bands (thin colored lines) would provide an area of strong buying support for stocks. The odds of the S&P 500 blowing through these bands without so much as a countertrend rally to the upside are remote at best.

Those who are calling for the Fed to raise rates in response to rising oil prices are underestimating the Fed’s focus on asset prices, balance sheets, and employment. We agree with the comments below, which also appeared via Bloomberg this morning:
“Things will not change materially with regards to monetary policy in 2011 and perhaps heading out into 2012,” said Brian Levitt, New York-based economist at Oppenheimer Funds Inc., which manages $182 billion. “They will complete Quantitative Easing 2, and the fed funds rate will remain effectively at zero for the rest of the year.”
While we do not believe the bears are on their way to recapturing the primary trend, we do respect the need to continue to prepare for the possible onset of a correction in asset prices. Below, we outline some specific strategies we may use in the coming days and weeks depending on how things play out. We have already been raising cash slowly over the past week, cutting back on positions in consumer discretionary (XLY), transportation (IYT), and industrials (XLI).
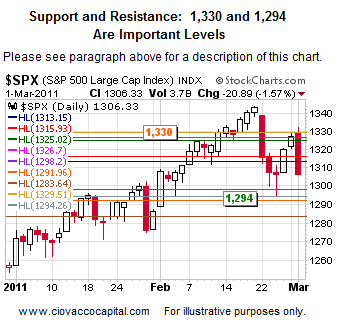
In the short-term, if the S&P 500 can close above 1,330, we would be more inclined to hold our current positions, including energy (XLE), oil equipment/services (IEZ), and materials (IYM). A close below 1,294 would increase the odds of us taking further defensive action using the incremental approach. We may take steps to reduce positions in the broad U.S. market (VTI), technology (QQQQ), and mid-caps (IWP).

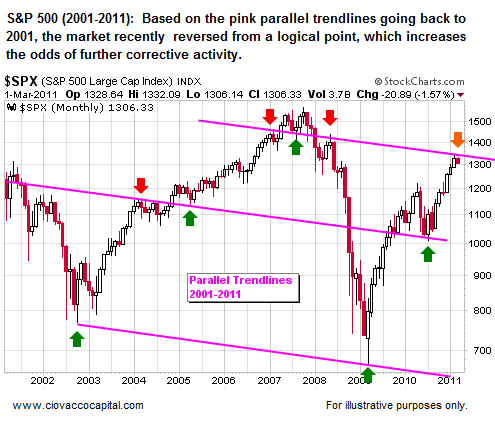
Part of the rationale for doing some selling in the past week or so is the S&P 500 failed to overtake the upper pink trendline shown below. These parallel trendlines have acted as both support (green arrows) and resistance (red arrows) going all the way back to 2002.

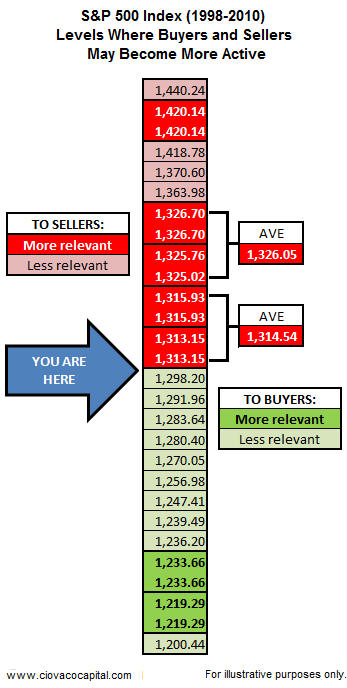
Our strategy to possibly redeploy some of our cash will depend on both new fundamental data and technical readings. If stocks can find some buying support near one of the levels we identified on January 6 (see below), we would consider taking positions from the “shopping lists” presented on March 1 and February 10. We still like energy (XLE), silver (SLV), agriculture (DBA), numerous energy-related sub-sectors (IEZ, XOP, XES, OIH), natural resources (IGE), and technology (FDN, SMH).

By Chris Ciovacco
Ciovacco Capital Management
Copyright (C) 2011 Ciovacco Capital Management, LLC All Rights Reserved.
Chris Ciovacco is the Chief Investment Officer for Ciovacco Capital Management, LLC. More on the web at www.ciovaccocapital.com
Ciovacco Capital Management, LLC is an independent money management firm based in Atlanta, Georgia. As a registered investment advisor, CCM helps individual investors, large & small; achieve improved investment results via independent research and globally diversified investment portfolios. Since we are a fee-based firm, our only objective is to help you protect and grow your assets. Our long-term, theme-oriented, buy-and-hold approach allows for portfolio rebalancing from time to time to adjust to new opportunities or changing market conditions. When looking at money managers in Atlanta, take a hard look at CCM.
All material presented herein is believed to be reliable but we cannot attest to its accuracy. Investment recommendations may change and readers are urged to check with their investment counselors and tax advisors before making any investment decisions. Opinions expressed in these reports may change without prior notice. This memorandum is based on information available to the public. No representation is made that it is accurate or complete. This memorandum is not an offer to buy or sell or a solicitation of an offer to buy or sell the securities mentioned. The investments discussed or recommended in this report may be unsuitable for investors depending on their specific investment objectives and financial position. Past performance is not necessarily a guide to future performance. The price or value of the investments to which this report relates, either directly or indirectly, may fall or rise against the interest of investors. All prices and yields contained in this report are subject to change without notice. This information is based on hypothetical assumptions and is intended for illustrative purposes only. THERE ARE NO WARRANTIES, EXPRESSED OR IMPLIED, AS TO ACCURACY, COMPLETENESS, OR RESULTS OBTAINED FROM ANY INFORMATION CONTAINED IN THIS ARTICLE. PAST PERFORMANCE DOES NOT GUARANTEE FUTURE RESULTS.
Chris Ciovacco Archive |
© 2005-2022 http://www.MarketOracle.co.uk - The Market Oracle is a FREE Daily Financial Markets Analysis & Forecasting online publication.


