Most Popular
1. It’s a New Macro, the Gold Market Knows It, But Dead Men Walking Do Not (yet)- Gary_Tanashian
2.Stock Market Presidential Election Cycle Seasonal Trend Analysis - Nadeem_Walayat
3. Bitcoin S&P Pattern - Nadeem_Walayat
4.Nvidia Blow Off Top - Flying High like the Phoenix too Close to the Sun - Nadeem_Walayat
4.U.S. financial market’s “Weimar phase” impact to your fiat and digital assets - Raymond_Matison
5. How to Profit from the Global Warming ClImate Change Mega Death Trend - Part1 - Nadeem_Walayat
7.Bitcoin Gravy Train Trend Forecast 2024 - - Nadeem_Walayat
8.The Bond Trade and Interest Rates - Nadeem_Walayat
9.It’s Easy to Scream Stocks Bubble! - Stephen_McBride
10.Fed’s Next Intertest Rate Move might not align with popular consensus - Richard_Mills
Last 7 days
It's Five Nights at Freddy's Again! - 12th Jan 25
Squid Game Stock Market 2025 - 5th Jan 25
Stock Market Bubble Drivers, Crypto Exit Strategy During Musk Presidency - 27th Dec 24
Gold Stocks’ Remain Exceptionally Weak Even as Stocks Rise - 27th Dec 24
Gold’s Remarkable Year - 27th Dec 24
Stock Market Rip the Face Off the Bears Rally! - 22nd Dec 24
STOP LOSSES - 22nd Dec 24
Fed Tests Gold Price Upleg - 22nd Dec 24
Stock Market Sentiment Speaks: Why Do We Rely On News - 22nd Dec 24
Never Buy an IPO - 22nd Dec 24
THEY DON'T RING THE BELL AT THE CRPTO MARKET TOP! - 20th Dec 24
CEREBUS IPO NVIDIA KILLER? - 18th Dec 24
Nvidia Stock 5X to 30X - 18th Dec 24
LRCX Stock Split - 18th Dec 24
Stock Market Expected Trend Forecast - 18th Dec 24
Silver’s Evolving Market: Bright Prospects and Lingering Challenges - 18th Dec 24
Extreme Levels of Work-for-Gold Ratio - 18th Dec 24
Tesla $460, Bitcoin $107k, S&P 6080 - The Pump Continues! - 16th Dec 24
Stock Market Risk to the Upside! S&P 7000 Forecast 2025 - 15th Dec 24
Stock Market 2025 Mid Decade Year - 15th Dec 24
Sheffield Christmas Market 2024 Is a Building Site - 15th Dec 24
Got Copper or Gold Miners? Watch Out - 15th Dec 24
Republican vs Democrat Presidents and the Stock Market - 13th Dec 24
Stock Market Up 8 Out of First 9 months - 13th Dec 24
What Does a Strong Sept Mean for the Stock Market? - 13th Dec 24
Is Trump the Most Pro-Stock Market President Ever? - 13th Dec 24
Interest Rates, Unemployment and the SPX - 13th Dec 24
Fed Balance Sheet Continues To Decline - 13th Dec 24
Trump Stocks and Crypto Mania 2025 Incoming as Bitcoin Breaks Above $100k - 8th Dec 24
Gold Price Multiple Confirmations - Are You Ready? - 8th Dec 24
Gold Price Monster Upleg Lives - 8th Dec 24

Market Oracle FREE Newsletter

How to Protect your Wealth by Investing in AI Tech Stocks

Elliott Wave on the DOW Ending Diagonal Pattern, Short term Forecast

Stock-Markets / Stock Markets 2011 Mar 06, 2011 - 12:21 PM GMT

By: Dan_Stinson

Stock-Markets

Many investors are confused with the choppy action on the DOW, so we have provided a chart to illustrate our forecast on the expected price action.


This corrective action is an ending diagonal pattern which is a terminal pattern. We should see further upside towards the recent highs with a a sharp decline to at least the starting point of the ED pattern. We will likely see a brief rally at this level before further downside.

DOW
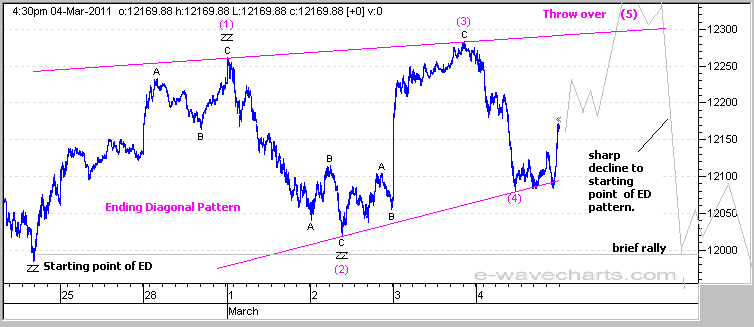

Once this pattern completes we are expecting a major reversal with significant downside to follow. This will be end of the current wave up with two possibilities on the downside targets. Once the reversal begins we should have more insight on which target area will play out.

We also have been following longer term Ending Diagonal patterns for the CAD and and Crude which are also close to completion.

These charts are only a guide so that you can follow the action and watch for the expected outcome. The action could play out exactly as illustrated or it may need minor adjustments as we follow it through.

If you are interested in viewing these updated charts and other detailed charts with targets on a daily basis, please see the registration details below.

Elliott Wave Chart Site - IntraDay Market Updates on the DOW, Nasdaq, S&P500, Gold, Silver, HUI and the USD.

By Dan Stinson
http://www.e-wavecharts.com

© Copyright 2011

To learn more on the status of Gold, Silver, HUI and the USD, please visit the link below for registration details.
The commentary and forecasts are updated daily, including intraday commentary and chart updates. Fibonacci pivot dates and cycle analysis are also utilized to forecast reversal dates. The indices covered include the NASDAQ, DOW, S&P 500, SOX, Nikkei, DOW Transports, TSX, BSE, KSE, AORD, HSI, DAX and FTSE. Commodity charts include Copper, XOI, Crude Oil, Nat Gas, Gold, GLD ETF, Silver, SLV ETF, HUI and/or the XAU (Gold and Silver index). Additional Elliott Wave charts cover the US Dollar (USD), EURO FXE ETF, Canadian Dollar (CAD) FXC ETF, 10 Year Treasury Note Yield (TNX), Bank Index (BKX)

Dan Stinson Archive

© 2005-2022 http://www.MarketOracle.co.uk - The Market Oracle is a FREE Daily Financial Markets Analysis & Forecasting online publication.


Post Comment

Only logged in users are allowed to post comments. Register/ Log in