Gold and Silver Parabolics 2011
Commodities / Gold and Silver 2011 Mar 10, 2011 - 04:22 AM GMTBy: John_Townsend
 As you will discover from the charts and information in this article, the previous three gold and silver parabolics (2004, 2006 and 2008) had a common characteristic. Each exhibited a midpoint consolidation - a resting place that separated the character of the first half and second half of the parabolic move. This observation is particularly relevant at this time, as both gold and silver have presently completed this midpoint consolidation and are already on their way to concluding the 2011 parabolic.
Let's begin with the previous parabolics in gold and silver and work our way towards the current situation. At the conclusion I will show you what I think is likely to power the 2011 parabolics to completion.
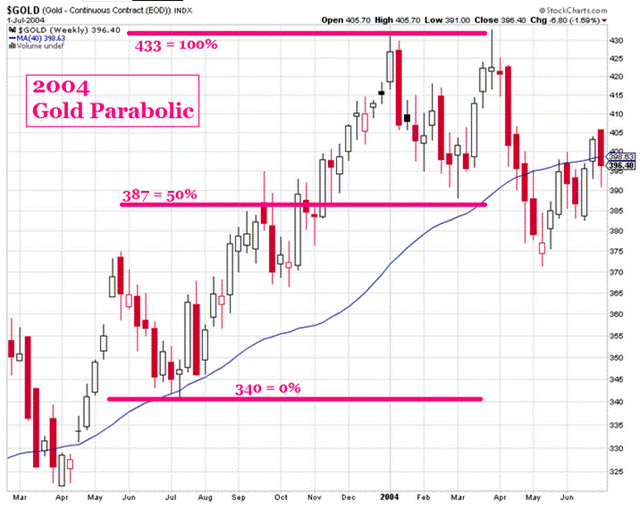
The gold 2004 parabolic had a midpoint consolidation around and below the $387 price area. Once price cleared this area, the second half of the move was both decisive and relentless.
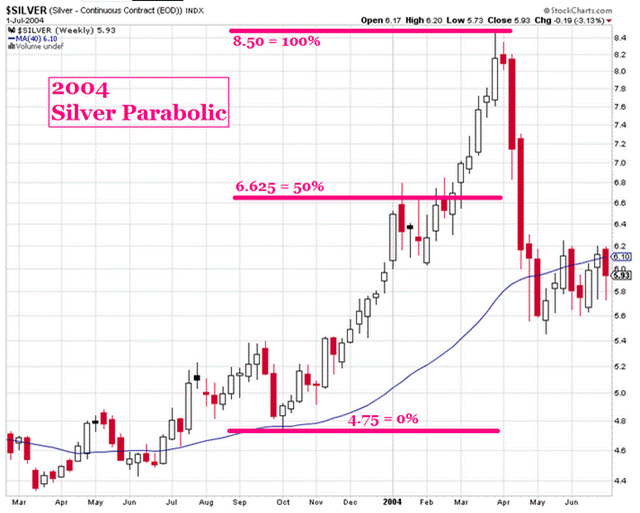
The silver 2004 parabolic consolidated at and below the $6.62 price level. As with the 2004 gold parabolic, once price cleared the consolidation area it continued higher powerfully and without hesitation.
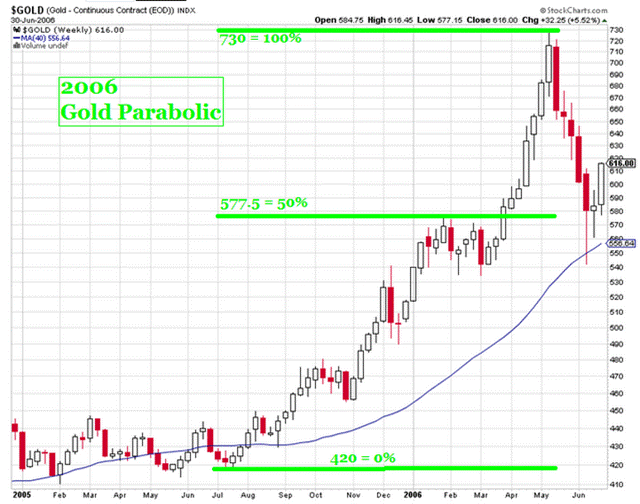
The 2006 gold parabolic consolidated at and below the 577 price area. Once price cleared this range it headed north and without wavering or hesitation.
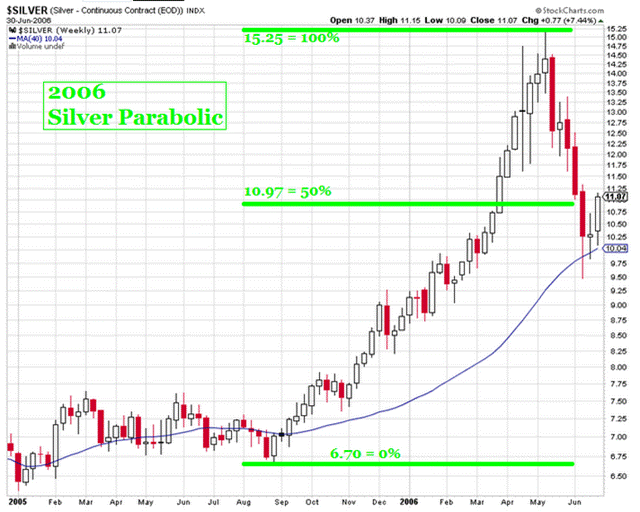
The 2006 silver parabolic spent quite a number of weeks back and filling before reaching its half way point just below $11.00. But once the first leg was concluded price movement was nearly vertical and extremely swift.
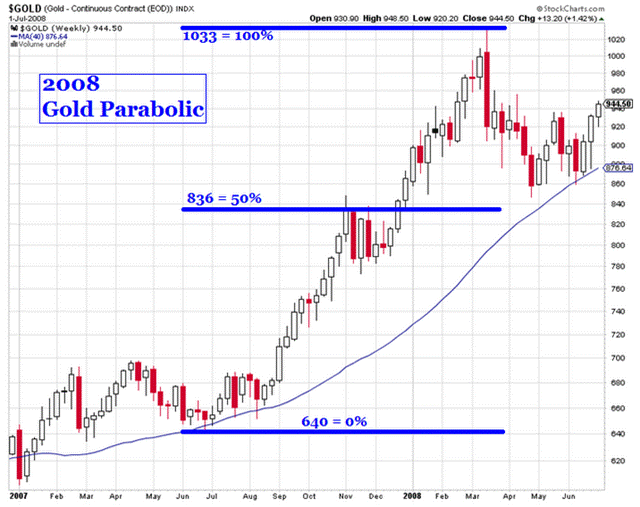
The 2008 gold parabolic featured a pennant pattern that divided the entire move into two equal segments, and formed just under the $836 price area. Price in the upper half of the move needed to slow itself down a couple times (red candles) to keep in essentially identical slope with the lower leg of the move.
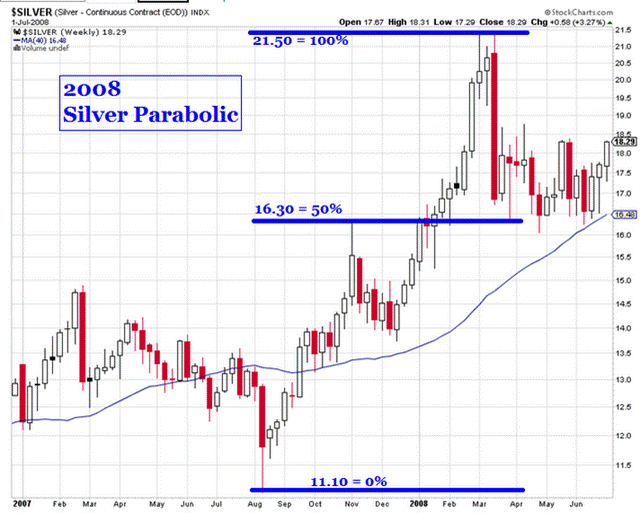
The 2008 silver parabolic exhibited a bull flag at about the 1/3 mark, then spent a few weeks consolidating half way up the entire move, around $16.30. As we have observed to be typical, the upper half of the parabolic move, once it left the midpoint consolidation area, was swift, decisive and powerful.
This now brings us to our current 2011 gold and silver parabolic. I am switching software at this point from charts by StockCharts to FreeStockCharts, the reason being that the latter allows me to adjust the price height of anticipated future price movement.
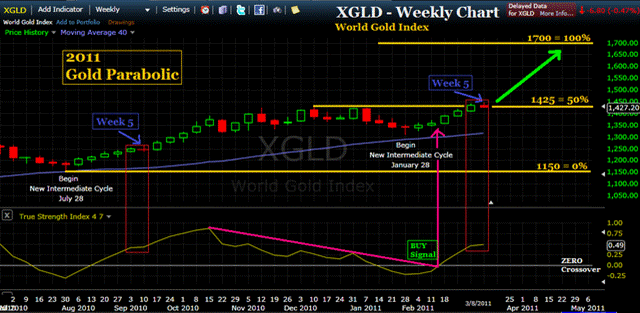
So here is our present situation with gold. It appears to me that the midpoint price consolidation area has occurred beneath the $1425 price level. Gold appears ready to rocket launch into the upper half of its parabolic move. Price is projected to the $1700 area.
This current week appears as a red candle breather, similar to the price action of the preceding intermediate cycle. The True Strength Index (TSI) momentum indicator is rising above ZERO and I expect it will continue to rise.
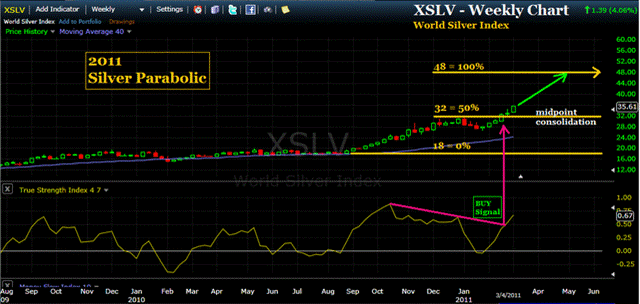
Silver is a step ahead of gold in that it has already broken above its midpoint consolidation price area of $32, and is presently trading near $36. The weekly TSI indicator as yielded a bullish trend line break buy signal and I expect silver to continue higher week after week, as it has in the 2nd half of each previous parabolic move. Using the midpoint consolidation concept, price is projected some 40% higher to around $48.
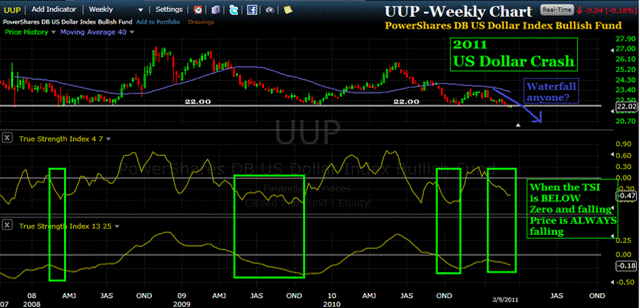
Finally, here is a weekly chart of PowerShares DB US Dollar Index Bullish Fund (UUP) which I am using as a proxy for the chart of the US Dollar.
We can see that the US Dollar is literally on the precipice of a waterfall decline below key support at 22. This roughly translates into 76 on the US Dollar Index.
The TSI momentum indicator is below ZERO and falling. This is bad news for the US Dollar and I view it highly unlikely it will be able to rebound, let alone hold this level. Once the US Dollar begins to fall below support it will trigger both panic and a flight to gold and silver. And I believe this will power the concluding leg of the 2011 gold and silver parabolics.
I wish you a great week of trading and invite you to peruse my website, The TSI Trader, where you will find a focus on both the techniques of using the True Strength Index (TSI) indicator for accurate trading signals and the secular bull market for precious metals.
John Townsend mailto:TSItrader@gmail.com
© 2011 Copyright John Townsend - All Rights Reserved
Disclaimer: The above is a matter of opinion provided for general information purposes only and is not intended as investment advice. Information and analysis above are derived from sources and utilising methods believed to be reliable, but we cannot accept responsibility for any losses you may incur as a result of this analysis. Individuals should consult with their personal financial advisors.
© 2005-2022 http://www.MarketOracle.co.uk - The Market Oracle is a FREE Daily Financial Markets Analysis & Forecasting online publication.


