


Dow Jones Index Break of 13,000 Would Signal Bear Market and Recession
Stock-Markets / Stock Market Valuations Nov 07, 2007 - 08:36 PM GMTBy: Brian_Bloom

 Assuming reversion to the mean, and assuming historical earnings and dividends are maintained, the $SPX could pull back to 912 (40%) and the Dow Jones Industrials could pull back to 10018 (25%). Strictly speaking, this assumes three things:
- The mood on Wall Street turns Primarily Bearish – thereby pointing to a reassessment based on fundamentals
- Earnings remain constant
- There is a reversion to the historical mean
The main problem with the above is that, for Wall Street to turn bearish and focus on fundamentals, investors would have to be anticipating a deteriorating economy. It follows that, going forward, the expectation will be that earnings will likely deteriorate.
The table below, source: http://www.decisionpoint.com /prime/dailycharts/mktsummEARN .html
shows dividend yields on industrials of between 1.8% and 2 .2%, and P/E ratios of between 16 and 18X as at November 6 th 2007.
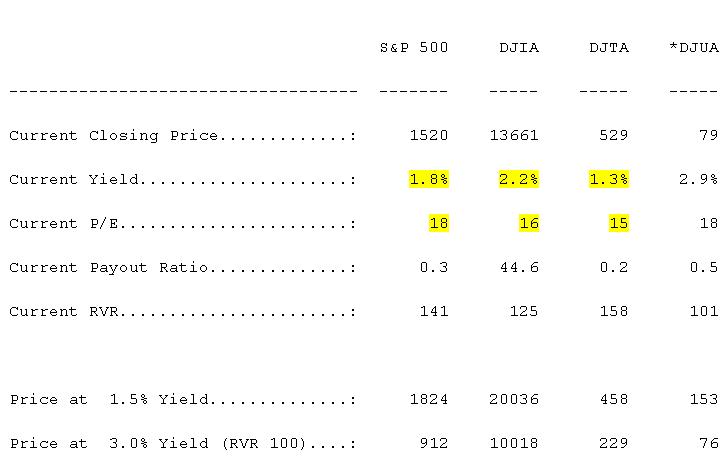
Historically, 3% Dividend Yield has been the mean over the long term, and 12X has been the mean Price:Earnings ratio
There is a measure or “Key Performance Indicator” of the health of any business, and that is the ratio of its EBIT (Earnings Before Interest and Tax) to Revenue.
Thus, for example, let's look at the formula
Revenue - Expenses excluding Interest = Profits (EBIT)
For discussion purposes, let's examine a purely imaginary situation, which has the following underlying assumptions:
- Revenue = 100
- Expenses = 85
- Ratio of Fixed:Variable Expenses is 60:40, thus:
- Fixed = 51
- Variable = 34
- Revenue falls from 100 to 90
Case 1:
Revenue = 100
100 – (51+34) = 15 (EBIT:Revenue ratio = 15%)
Case 2: (Revenue falls by 10% and variable costs fall by 10%, but fixed costs remain constant)
90 – (51+30.6) = 8.14 (EBIT:Revenue ratio falls to 9%)
Thus, if revenue falls by 10%, EBIT falls by 45%
Interim Conclusion #1
Regardless of the ratio of fixed to variable costs, and regardless of whether or not Corporate Management moves to cut “fixed” costs in a recession, it is self evident that EBIT will fall faster than revenue in the short to medium term if fixed costs are not cut in line with falling revenue. By how much depends on how savagely management moves to cut fixed costs. Typically, fixed costs are not cut in line with revenue because this impacts negatively on the business' ability grow when the economy recovers, and management is not paid to shrink businesses.
Typically, in a recession, GDP does not shrink by 10%. It might contract by (say) 3% in real terms. Thus, if inflation is running at around (say) 5%, companies might even be reporting slowly growing revenues and profits in dollar terms.
I can't prove it, but my gut is telling me that this (in principle) is what has been happening in the USA over the past few months. i.e. Volumes have been shrinking whilst prices have been rising to mask recessionary conditions.
There are three “clues” which have led me to this gut feeling:
- The oil price has been rising, and oil is the fulcrum on which the world economy balances. When the oil price rises, something else has to give in order for equilibrium to be maintained. What that “something” is, is a combination of falling volumes and rising prices of other goods.
- Exxon's most recent quarterly report does indeed show that they have been experiencing a contraction of volume of throughput
- Recent market research has shown that 48% of Americans are lying awake at night, worrying about money.
Now, let's look at what is likely to happen if we have two consecutive years of falling volumes.
Under these circumstances, logic dictates that corporate management will move to cut fixed overheads. From a business perspective this would be a sensible thing to do, but from an economic perspective, this will be like a snake eating its own tail. The recession starts to feed on itself. Retrenched employees cut back on living expenses and volumes contract even further.
Now the Fed tries to kick start the economy by flooding the market with cheap money (which it has been doing for 20 years already). Inflation kicks in, but the unemployed, who have no income to start with, become even less able to live on a day to day basis (as will be the case with retirees). Further, employees who have retained their jobs will be faced with a choice:
- Kick up a fuss and push for a wage increase (thereby encouraging employers to downsize yet further, thereby leading to a further reduction of volumes across the economy)
- Bite the bullet, and consume less (thereby further reducing volumes across the economy)
In this analyst's view, it has been their vague gut understanding of the above that has been causing American consumers to lie awake worrying.
Interim Conclusion #2
There comes a point in the business cycle where increasing the money supply become counterproductive, leading to a reduction in the velocity of money.
Now, if I am right and we are already experiencing contractions in volumes then it follows that, within the next 12-18 months, companies which are not export oriented (and are unable to capitalise on the falling dollar) will begin to experience contracting earnings. This should show up on the charts. In particular, we should get a Dow Theory sell signal if the Dow Jones Industrials and the Dow Jones transports both fall to lower lows.
Let's have a look at the weekly charts, courtesy decisionpoint.com
From the above chart it becomes visually apparent that the Transports have already fallen to a lower low. Ignoring the “downward spike” around August/September, if the Dow Jones Industrials falls to below 13,000 then this will give rise to a Dow Theory sell signal.
What is the probability of the DJIA falling to below 13,000?
The 3% X 3 box reversal chart below (courtesy stockcharts.com ) gave a “buy” signal when it broke above 14,000.
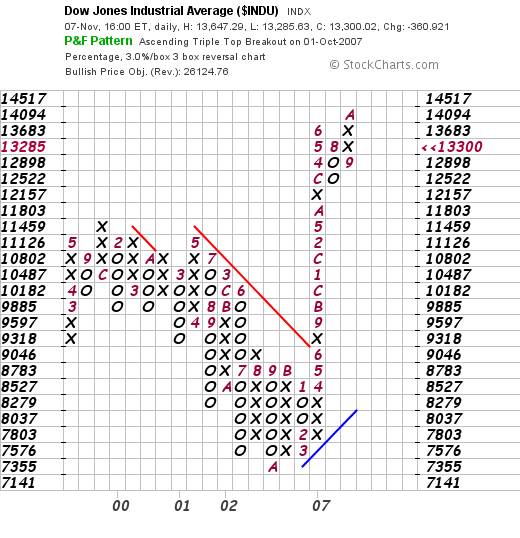
However, at 13,300 it is showing signs of wanting to reverse that buy signal. Furthermore, if the Dow falls below 12898 it can be seen that this will represent a “high pole reversal” sell signal and the price could come all the way back to 8,783 – which would imply a higher dividend ratio than 3%, assuming dividends remained constant.
Interim conclusion #3
If the Dow Jones Industrial Index breaks below 13,000 (thereby giving a Dow Theory Sell signal) then the price target of 8,783 implies that the market will be anticipating recessionary conditions.
But this still doesn't tell us anything about probabilities, so let's look at the next chart (courtesy Bigcharts.com )
This chart shows indecision given that the On Balance Volume has been bumping along the zero level for the past six months. However, in the past couple of days, both the oscillator and the Parabolic SAR are showing slight negativity.
Interim Conclusion #4
There is as yet no direct evidence that the buy signal is going to reverse itself.
….. which is why we need to look at the Relative Strength Charts
The following chart (courtesy stockcharts.com ) shows that a point of decision has been reached in that the ratio of the Gold Shares to The Dow Jones has virtually reached a Double Top
That this double top is unlikely to be breached on the upside in the immediate future flows from the fact that the oscillator (not shown here) is in deeply overbought territory.
Based on other analysis (also not shown here) what this implies is that the gold shares are more likely to pull back than the DJIA is to break to the upside.
Further, if we look at the relationship of gold shares to the gold price itself, we see that it is also bouncing up against resistance
Conclusion
The “panic” following Citi Group's $11 billion loss announcement, and the steep fall in the US Dollar seems to be abating. The markets seem likely to mark time for the time being
The chart below (source: http://www.gold.org/value /stats/statistics/dailyshort200 0.html ) shows that the gold price in Euros has not yet broken up to a new high – i.e. The “fall back” currency from the perspective of the Big Money is still the Euro as opposed to gold.
Finally, the two charts below (courtesy stockcharts.com ) may give us an early warning indicator.
The first chart shows that the oil price has become significantly overbought relative to its measured move target of 87, and the probabilities favour a pullback
The second chart – of the share price of the world's largest oil company – shows a high pole warning signal.
The share price of Exxon is high above its trendline and is likely to either consolidate or pull back to reflect shrinking underlying profits.
Overall conclusion
Whilst the markets are balanced on a knife edge, there is no objective evidence (yet) of an impending crisis of confidence. Both the industrial markets and the gold markets look likely to consolidate around these levels. Nevertheless, fundamentally the balance of probabilities does not favour a break up in the Industrials Index unless the US economy experiences export led growth.
As yet, there is no sign of any wave of export led activity. Therefore, the risks must be interpreted to be biased towards the downside.
13,000 represents a key level of support on the Dow Jones Industrial Index. This needs to hold for the World's Central Banks to be able to hold everything together. Meanwhile, the $1400 per ounce target for the gold price remains intact – but with no time horizon.
By Brian Bloom
www.beyondneanderthal.com
Since 1987, when Brian Bloom became involved in the Venture Capital Industry, he has been constantly on the lookout for alternative energy technologies to replace fossil fuels. He has recently completed the manuscript of a novel entitled Beyond Neanderthal which he is targeting to publish within six to nine months.
Author's comment - It appears that the authorities have not yet come to understand the subtleties and/or the nuances of the statement that “energy drives the world economy”. An unholy alliance between the Banking Industry, the Fossil Fuel Industries, Big Business and the Politicians has given rise to a life-threatening accident that is now waiting to happen.
The time has come for the world to begin migrating to a new platform of industrial, consumer and transport technologies which will be driven by electromagnetic energy. There are three such energy technologies which are introduced in my novel, Beyond Neanderthal , which is targeted for publication in March 2008. The logic which underpins these technologies is compelling. If embraced, they have the capacity to usher in a new era of human evolution.
By means of its entertaining storyline, Beyond Neanderthal explains both the logic and the technologies themselves, and also articulates a clear pathway forward. If taken, this pathway will enable us to extricate ourselves from the quagmire into which we have been led by the unholy alliance of self-interested groups. There is still a window of opportunity to act – but the evidence suggests that this window will begin to close around 2012. Please register your interest to acquire a copy of the novel at www.beyondneanderthal.com .
Brian Bloom Archive |
© 2005-2022 http://www.MarketOracle.co.uk - The Market Oracle is a FREE Daily Financial Markets Analysis & Forecasting online publication.