Gold and Silver Rally Lacks Momentum
Commodities / Gold and Silver 2011 Mar 27, 2011 - 10:24 AM GMTBy: Merv_Burak
 The precious metals had a great week, so why is the momentum of these moves so lacking in strength? Speculators who can move prices seem not yet to be convinced that gold stocks will continue zooming into ever higher ground. Is there peace in the oil fields or something?
GOLD LONG TERM
Nothing lately has affected the long term indicators or ratings for gold. Before checking out the indicators what’s the latest with the long term P&F chart? Well, from the previous analysis from the 05 Nov 2010 Commentary we have our next projection level at $1600 (actually at $1575 but what the heck, so many are saying $1600 I might as well also). After that we have the next one at $2050 and then on to $2600. Should things not turn out as projected on the up side, well the P&F support is now above the $1300 mark so a move to $1300 would be a bear. The present projection on the down side would then be $1025 but that would most likely change by time a break might come.
Gold continues to trade above its positive sloping long term moving average line. The long term momentum indicator remains in its positive zone but showing weakness in its strength versus that shown for the price action itself. This suggests, to me, that the internal strength is getting weaker and speculators are not as enthusiastic about the up side as they were earlier. The momentum indicator has just dropped below its trigger line and the trigger has turned downward. The volume indicator is still showing strength and is in new high levels above its positive trigger line. Now, volume is always a good indicator of speculative interest BUT I always remember that too often volume is the last indicator to go negative AFTER a top had been formed and prices are falling. Bullish investors are not looking at the technical charts and continue buying even after the top has occurred. For now everything is still BULLISH on the long term.
INTERMEDIATE TERM
Everything still looks great on the intermediate term but there are signs that a change may not be far away. Yes, I know. Everyone is saying that gold is going through the roof and you should jump on the bandwagon. I wish it was so. What I am suggesting here is that the momentum of the price move is not all that great and although the price could continue to go higher, much higher, with lower momentum it is something to keep in mind and be prepared, JUST IN CASE. For now gold is still above its positive sloping moving average line and the momentum indicator is still in its positive zone above its positive sloping trigger line. The two, momentum and trigger, are very close and one more negative day would see the momentum drop below its trigger. For now it’s still positive. The volume indicator continues strong and is above its positive trigger line. The positive volume indicator may be a little misleading as you’ll see in the short term comments below. Putting all these intermediate term indicators together the intermediate term rating remains BULLISH.

SHORT TERM
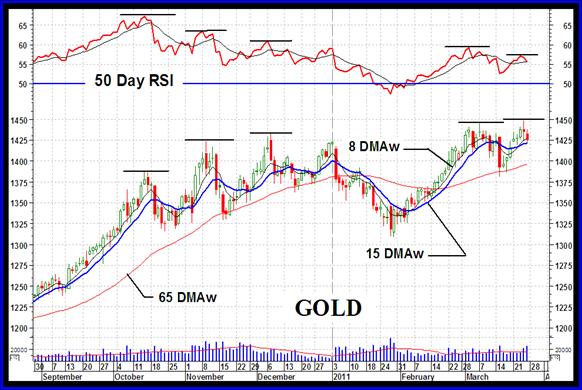
The chart shown here is more of an intermediate term chart and includes my intermediate term momentum indicator (the 50 day RSI). As one can easily see, as the price of gold made increasingly higher prices the momentum indicator continually peaked at a lower and lower level. Something’s gotta give. Either the price of gold turns lower and goes into some kind of reversal mode pulling the momentum into its negative zone OR the price does in fact take off and the momentum then strengthens and starts to make higher peaks again. Which will it be is anyone’s guess. I hope for the up side but in the end I let the market tell me what it is doing, I’m not about to tell the market what it should do.
So, what IS the market for gold bullion doing at this time as far as the short term perspective is concerned. Well, we had a short term rally in progress during the week but by the end of the week things started to deteriorate. The gold price is still above its positive sloping moving average line but the two are closing their gap with the price starting to head lower. The short term momentum indicator is giving us a slightly different message than the intermediate term momentum did. During the price peak in early March the short term momentum indicator (13 day RSI) did exceed the previous peaks (except for the highest peak in early Oct) but the slightly higher price this past week had seen a severely diminished momentum. The short term momentum is once more suggesting weakness although it did strengthen there for a few weeks. The daily volume action is giving us a different story from that given by the volume indicator. On a daily basis the volume seems to be weak during the rally period and increase as the price turns around and moves lower. Not an encouraging scenario. Still, when putting all the indicators together we get a short term BULLISH rating. The very short term moving average line has moved above the short term line for a confirmation of this bull.
SILVER

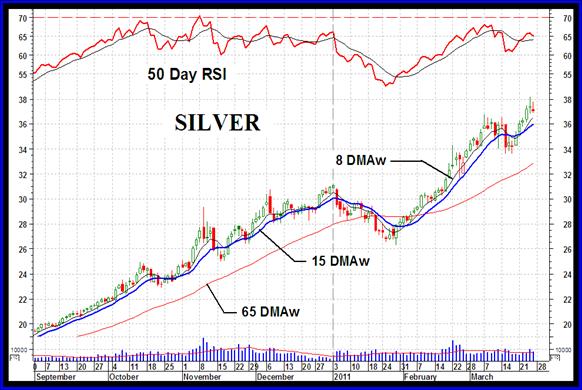
We have here a direct comparison between the price and intermediate term momentum action for silver versus gold. One can quickly see the better performance that silver has been giving versus gold. The momentum indicator, although also showing some weakness, is not as weak as that of gold. We had the negative divergences leading up to the 03 Jan 2011 price high but the recent early March action once more put life into the price move. Unfortunately, the move to new highs this past week has once more shown a momentum weakness. I guess we’ll just have to wait and see how this plays itself out. For now the rating for silver remains BULLISH for all three time periods.
PRECIOUS METAL STOCKS
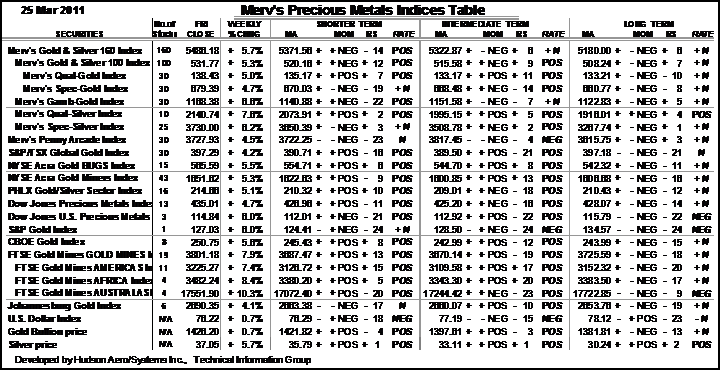
Despite the fact that gold moved very slightly into new all time high territory this past week NONE of the major Gold Indices, North American or Merv’s, made it into new high levels. Speculators, especially those who have the resources to move prices, seem not to be that gung-ho yet despite all the commentators and analysts screaming that gold is ready to zoom into the stratosphere. Maybe they are just holding back for another week or so to see what really will develop in the Middle East and elsewhere. For now they do not seem convinced that the new continuing highs in gold will have longevity.
Most of the Gold Indices made their highs during the first days of the new year. This included new highs in the long term momentum indicators. The rally of a couple of weeks ago did not reach new highs and was accompanied by a serious weakness in the long term momentum. Only the Silver Indices and the Penny Arcade had reached new peaks recently. In these cases the long term momentum indicators had shown negative divergence versus the Indices highs. So, even here where we still see strength, we also see weakness in the background.
Looking through my universe of 160 gold and silver stocks we had 138 (86%) advancing this past week and only 20 (13%) declining. With a ratio like that, one would be very brave to say that things are looking bad. I’m not all that brave but will only caution that things may not be all that good. The Penny Arcade, which is still in a bullish mode, is showing weakness not only in its momentum but also weakness versus the other Indices. This just may be the start of an early warning process but has not yet gone to the point of an actual warning, just an initial caution. Something to keep a watch on.
Merv’s Precious Metals Indices Table

Well, that’s it for this week. Comments are always welcome and should be addressed to mervburak@gmail.com.
By Merv Burak, CMT
Hudson Aero/Systems Inc.
Technical Information Group
for Merv's Precious Metals Central
For DAILY Uranium stock commentary and WEEKLY Uranium market update check out my new Technically Uranium with Merv blog at http://techuranium.blogspot.com .
During the day Merv practices his engineering profession as a Consulting Aerospace Engineer. Once the sun goes down and night descends upon the earth Merv dons his other hat as a Chartered Market Technician ( CMT ) and tries to decipher what's going on in the securities markets. As an underground surveyor in the gold mines of Canada 's Northwest Territories in his youth, Merv has a soft spot for the gold industry and has developed several Gold Indices reflecting different aspects of the industry. As a basically lazy individual Merv's driving focus is to KEEP IT SIMPLE .
To find out more about Merv's various Gold Indices and component stocks, please visit http://preciousmetalscentral.com . There you will find samples of the Indices and their component stocks plus other publications of interest to gold investors.
Before you invest, Always check your market timing with a Qualified Professional Market Technician
Merv Burak Archive |
© 2005-2022 http://www.MarketOracle.co.uk - The Market Oracle is a FREE Daily Financial Markets Analysis & Forecasting online publication.


