Stock Market Confirmed Uptrend
Stock-Markets / Stock Markets 2011 Apr 02, 2011 - 10:08 AM GMTBy: Tony_Caldaro
 The SPX/DOW confirmed a new uptrend this week. The uptrend will be counted as Major wave 3 of Primary wave III. This uptrend should last into June with a targeted range of SPX 1440-1462. For the week economic reports were mixed: ten improving and nine declining. On the upbeat we had personal income/spending, PCE prices, pending home sales, auto sales, the monetary base and leading wbase, the WLEI, the payrolls report, and the unemployment rate declined.
On the downbeat, Case-Shiller home prices, construction spending, the M1-multiplier, factory orders, consumer confidence, the Chicago PMI, the ADP index and weekly jobless claims weakened, and ISM manufacturing declined. For the week the SPX/DOW were +1.35%, and the NDX/NAZ were +1.45%. Asian markets rose 2.0%, European markets rose 2.0%, the Commodity equity group rose 1.5%, and the DJ World index rose 1.5%. US bonds lost 0.2%, Crude rose 2.5%, Gold slipped 0.1%, and the USD was -0.5%. Next week we have the FOMC minutes, ISM services, and Consumer credit.
LONG TERM: bull market
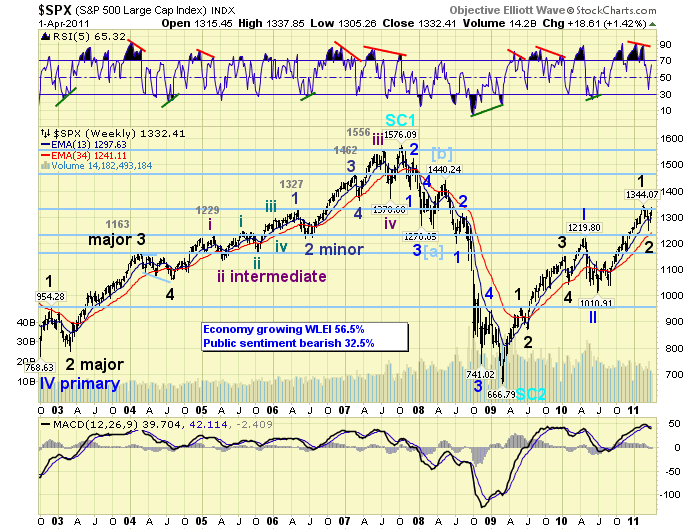
The bull market officially resumed this week with the Mar11 uptrend confirmation for Major wave 3 of Primary wave III. Major wave 2 had declined from Feb11 to Mar11 and SPX 1344 to 1249. Major wave 1 had lasted from July10 to Feb11 and rising from SPX 1011 to 1344. Typically the third wave of a third wave is the strongest part of a bull market. We’re not really expecting this type of outcome this time around. In this bull market the first waves have been quite strong, while the third waves have been a bit weaker, and the fifth waves quite weak in comparison.

When we review the weekly chart we observe Major wave 2 of Primary I, and Major wave 2 of Primary III had similar characteristics. Both started with a negative divergence, both lasted one month, both declined just under SPX 100 points, and both approached an RSI oversold but never actually hit it. Also, our bull market characteristics remain intact. RSI gets extremely overbought but hardly oversold, and MACD in positive territory most of the time and hardly at neutral.
MEDIUM TERM: uptrend underway
The bull market wave pattern, thus far, is quite clear. This bull market is Cycle wave [1] of a multi-decade Supercycle wave 3. This Cycle wave bull market will divide into five Primary waves. Primary wave I completed in Apr10 at SPX 1220. It consisted of five Major waves: Major 1 SPX 956 Jun09, Major 2 SPX 869 Jly09, Major 3 SPX 1150 Jan10, Major 4 SPX 1045 Feb10, and Major 5 SPX 1220 Apr10. Primary wave II then corrected from Apr10-Jly10 and from SPX 1220 to 1011. Then Primary wave III began. Thus far, only Major waves 1 and 2 of Primary III have completed: Major 1 SPX 1344 Feb11, and Major 2 SPX 1249 Mar11. Major waves 3, 4 and 5 are still required before Primary III concludes.

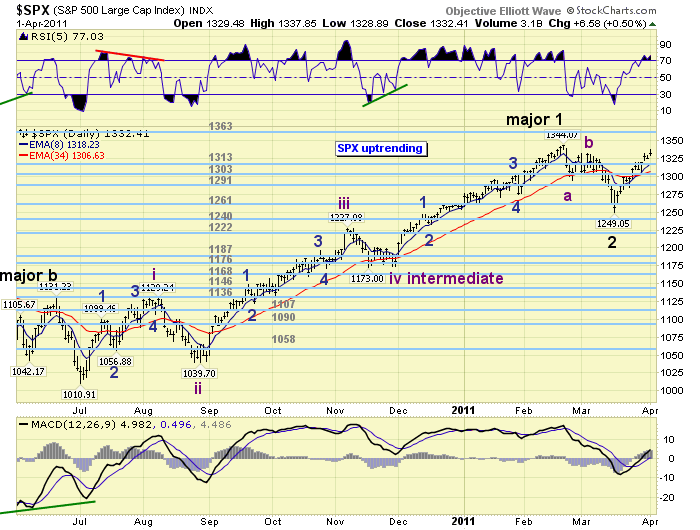
Major wave 3, the current uptrend, should consist of five Intermediate waves. All impulsing Major waves divide into five Intermediate waves. Generally, we’re expecting about a 100 point rally, a 50 point pullback, another 100 point rally, followed by another 50 point pullback, and then the final 100 point rally to complete the five waves. This would give us a nice five Intermediate wave advance, of about 200 points overall, from SPX 1249 into the targeted 1440-1462 range. Currently the SPX has rallied from 1249 to 1338 with the largest pullback only 17 points. It appears we’re still in Intermediate wave one.
SHORT TERM
Support for the SPX remains at 1313 and then 1303, with resistance at 1363 and then 1372. Short term momentum displayed another negative divergence at friday’s SPX 1338 high and finished the week at neutral. The uptrend, thus far, can be counted as three Minor waves: wave 1 SPX 1301, wave 2 SPX 1284 and wave 3 SPX 1338; with waves 1 and 3 about equal. Friday’s negative divergence suggests another pullback is underway to oversold levels. This could set up a Minor wave 4 pullback to about SPX 1320, then another rally to either SPX 1344 or the 1363 pivot to end Intermediate wave one. This potential scenario could serve as a potential roadmap for the week ahead. Best to your trading!
FOREIGN MARKETS
Asian markets were mostly higher on the week for a net gain of 2.0%. India’s BSE and China’s SSEC are in confirmed uptrends.
European markets were all higher on the week and also gained 2.0%. Only England FTSE is in a confirmed uptrend at this point.
The Commodity equity markets were all higher on the week and gained 1.5%. Brazil’s BVSP and Russia’s RTSI remain in uptrends.
The DJ World index gained 1.5% on the week and is in a confirmed uptrend.
COMMODITIES
Bond prices have been declining for a couple of weeks: -0.2% this week. Despite all the Bond Bubble – Crash and Burn talk over the past two years Bond prices have remained in a 115-128 trading range, and yields have remained between 2.33% and 4.01%.
Crude is making new highs again in its uptrend. It hit $108 on friday, +2.5% for the week. We still have an upside target of $111 for this uptrend.
Gold is uptrending but had a choppy week -0.1%. Silver is still leading and we’re expecting an important upside move in both shortly.
The USD is still downtrending and lost 0.5% on the week. It was up nearly 1% at one point on friday, but gave it all back to end negative on the day.
NEXT WEEK
Light economic week ahead. Tuesday kicks it off with ISM services and the FOMC minutes. On thursday, weekly Jobless claims and Consumer credit. Then on friday Wholesale inventories. On monday FED chairman Bernanke gives a speech, after hours, at the Atlanta FED. Then on wednesday FED director Hunter gives Sentate testimony. Looks like a quiet week ahead on the US front. Best to you and yours!
CHARTS: http://stockcharts.com/def/servlet/Favorites.CServlet?obj=ID1606987
http://caldaroew.spaces.live.com
After about 40 years of investing in the markets one learns that the markets are constantly changing, not only in price, but in what drives the markets. In the 1960s, the Nifty Fifty were the leaders of the stock market. In the 1970s, stock selection using Technical Analysis was important, as the market stayed with a trading range for the entire decade. In the 1980s, the market finally broke out of it doldrums, as the DOW broke through 1100 in 1982, and launched the greatest bull market on record.
Sharing is an important aspect of a life. Over 100 people have joined our group, from all walks of life, covering twenty three countries across the globe. It's been the most fun I have ever had in the market. Sharing uncommon knowledge, with investors. In hope of aiding them in finding their financial independence.
Copyright © 2011 Tony Caldaro - All Rights Reserved Disclaimer: The above is a matter of opinion provided for general information purposes only and is not intended as investment advice. Information and analysis above are derived from sources and utilising methods believed to be reliable, but we cannot accept responsibility for any losses you may incur as a result of this analysis. Individuals should consult with their personal financial advisors.
© 2005-2022 http://www.MarketOracle.co.uk - The Market Oracle is a FREE Daily Financial Markets Analysis & Forecasting online publication.


