What the NYSE New Highs Are Saying About the Stock Market Rally
Stock-Markets / Stock Markets 2011 Apr 04, 2011 - 10:44 AM GMTBy: Marty_Chenard
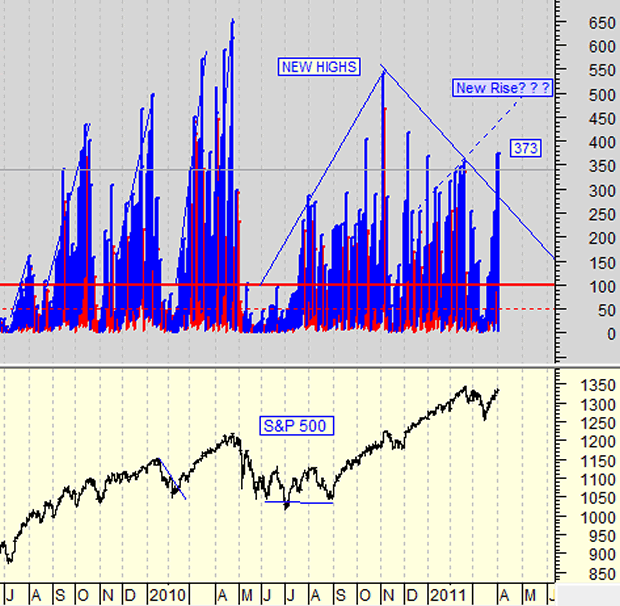
Today, we are reporting on the raw data for the daily NYSE New Highs. On this chart, a minimum of 100 is a very important level in a rally, and 150+ is what I want to see. 50 is neutral, and less than 50 is historically Negative.
(Reference information: This chart is only 1 of the 9 "Underlying Market Condition" charts that are posted everyday along with our market signal models and charts. From those charts, an Underlying Market Condition matrix is posted that shows the daily number of Negative, Neutral, and Positive readings.)
So, what does this chart look like after the close on Friday?
On Friday, the NYSE New Highs came in at a high reading of 373. That was strong enough to prompt the question of "whether or not the New Highs were starting new trending rise pattern?".
So, what's the answer? If Friday's level can sustain itself, this could be the start of a new trending rise which would mean that the Bull market's rally will continue for weeks. This would be true if all 9 Underlying Market Conditions shown in our matrix remain net positive.
(We would like to, but we don't post the daily matrix of Underlying Stock Market Conditions on this free site in fairness to our paid subscribers. Thank you for your understanding.)

* Feel free to share this page with others by using the "Send this Page to a Friend" link below.
By Marty Chenard
http://www.stocktiming.com/
Please Note: We do not issue Buy or Sell timing recommendations on these Free daily update pages . I hope you understand, that in fairness, our Buy/Sell recommendations and advanced market Models are only available to our paid subscribers on a password required basis. Membership information
Marty Chenard is the Author and Teacher of two Seminar Courses on "Advanced Technical Analysis Investing", Mr. Chenard has been investing for over 30 years. In 2001 when the NASDAQ dropped 24.5%, his personal investment performance for the year was a gain of 57.428%. He is an Advanced Stock Market Technical Analyst that has developed his own proprietary analytical tools. As a result, he was out of the market two weeks before the 1987 Crash in the most recent Bear Market he faxed his Members in March 2000 telling them all to SELL. He is an advanced technical analyst and not an investment advisor, nor a securities broker.
Marty Chenard Archive |
© 2005-2022 http://www.MarketOracle.co.uk - The Market Oracle is a FREE Daily Financial Markets Analysis & Forecasting online publication.


