


Weekly Gold and Silver Technical Analysis Report - Gold Technically Strong
Commodities / Gold & Silver Nov 11, 2007 - 03:33 PM GMTBy: Merv_Burak

Gold just keeps on trucking but Wednesday may have been a critical day. Read on to find out why.
SIMPLICITY
If you can't make it simple then it ain't worth making. So said a wise old man -- but I know not who. Anyway I try to follow that motto as best as I can in these commentaries. That is also a major reason I am a technician. Technical analysis can be very simple (but too many try to make it difficult). On the other hand, fundamental analysis is just difficult -- just difficult. My hat off to those who can master it and are able to profit from it.
You no doubt have noticed that in these commentaries I use the same technical concepts over and over and over again. They get to the point of being monotonous. However, they are the prime concepts in technical analysis and those presented here are among the simplest. They are trend (in the form of the moving average), trend strength (in the form of momentum) and speculative interest (in the form of volume). There are other technical concepts (Relative Strength comes to mind) but if you master these three you are well on your way to stock market profits with a minimum of risk, there is always risk and surprises.
Once you know the trend of a stock or commodity your odds of profit are greatly enhanced by trading “with the established trend”. An appropriate moving average line is the simplest trend identifier. As long as the stock or commodity is above the moving average line and the line continues to point upward you have a bullish trend. As long as the stock or commodity is below the moving average line and the line continues to point downward you have a bearish trend. You then trade in the direction of the trend, long or short.
There are different ways of defining what momentum indicators are or do (there are literally dozens of them). Their primary reason for existing is to warn you of potential danger ahead. I see them as defining the strength of the recent price action and if such strength is increasing or decreasing. Increasing strength suggests caviar and champagne while decreasing strength suggests bread and water. Most momentum indicators DO NOT by themselves define a reversal of trend but they are a powerful warning indicator and should not be ignored. Momentum indicators should be giving you the same story as the trend indicator, for confirmation of trend. Any difference between the two and you have a potential for a trend reversal.
When using a moving average to define a trend one should use an appropriate time period average to correspond to the investment time period of one's investment strategy. You would not use a 200 day moving average if your investment time horizon is the intermediate term. The same should be applied to the momentum indicator. Far to often investors use a momentum based upon a time period that is not appropriate for their investment strategy. Why use a 13 day RSI, as an example, if your investment strategy is for intermediate or long term investing?
The third concept is speculative interest in the form of volume of trading activity. There are very few simple volume indicators but some do exist. The indicator should define for you if the speculative interest is on the upside or downside. This speculative interest should be in the direction of the price movement, again to confirm the trend. Few serious price trends last long without this investor interest being in the trend direction.
I use these three simple concepts to define what's happening in the precious metals (and also in uranium in my new blog www.techuranium.blogspot.com ). Are they perfect? Of course not. Do they make mistakes? Of course they do. But they are mostly right most of the time. The thing is that one is taking on EXTRA RISK if one trades against the established trend as viewed by these concepts.
Inevitably I throw in lots of other concepts, techniques and methods into these commentaries to make it look like I know what I'm doing but these three concepts are all one really needs, most of the time.
Well, that was a full page without saying much but it was a good space filler as the weekly analysis of the gold activity is so straight forward this week.
GOLD : LONG TERM
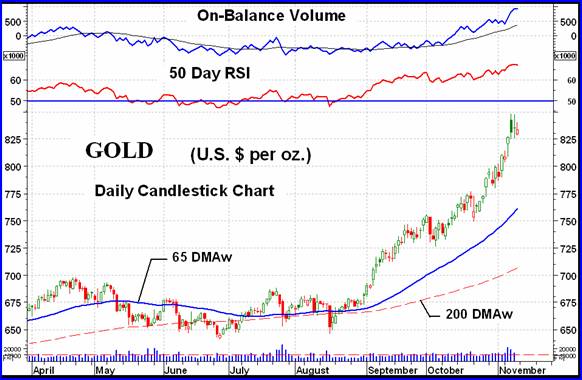
First, the long term P&F chart. The chart shown last week has now added two more X's on the up side to get it to the $840 level. It just seems that as every day goes by the next projected long term price of $915 becomes closer and closer. The upside move on the P&F chart has been straight up for so long that some kind of reaction is long overdue. I would be inclined to hold off on any new long term commitments until we have had a correction and some time to consolidate the recent gains, but that's only my view.
Looking at a bar or candlestick chart and the normal indicators, the price is above its long term moving average line and the line is nicely pointing upward. The long term momentum indicator has been improving lately and remains in its positive zone with the trend of the indicator also remaining positive. From the long term perspective volume, I find, is not all that important but even here volume has been improving quite well lately.
From all this I can only maintain my long term rating as BULLISH.
INTERMEDIATE TERM
Who said a picture is worth a thousand words? The chart tells it all. The price is well above its positive sloping moving average line. The momentum indicator is nicely above its neutral 50% line and pointing upward. The volume indicator showing continued speculative interest on the up side.
What is there to say but that the intermediate term rating remains BULLISH.
SHORT TERM
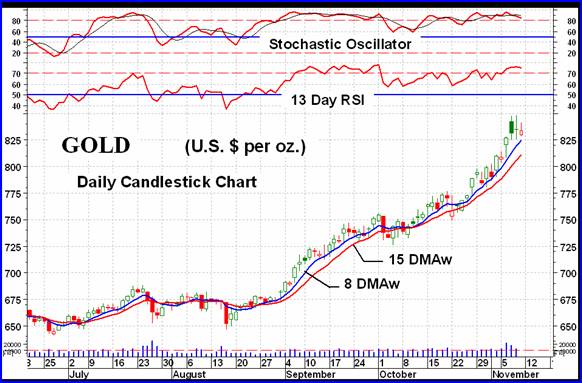
Well, here we can look a little more deeply into the recent action. At the beginning of the commentary I mentioned the Wednesday action. You can see from the chart that Wednesday was a good day, with an upside move on heavy volume. As I had mentioned in the past, the body of a candlestick chart shows the opening and closing daily prices. Also, if the body is solidly colored the closing price is the lower boundary of the body and if the body is not fully colored but “empty” then the closing price is the upper boundary of the body. We have a solid body on Wednesday indicating that the opening price was near the daily high and the closing price was near the daily low but still higher than Tuesday's close.
The trading action on Wednesday, once the opening was over, was mostly on the down side. This was a very clear warning of a loss of upside speculative interest and that whoever were the sellers had ruled the day. One could then expect the activity to reverse. Thursday say a see-saw battle with the price of gold closing almost at the same point as where it started. Friday was now a down day. Although all the indicators are still positive (see next paragraph) this activity has the feel of a trend halt and possibly a reversal.
Despite the analysis of the candlestick action above we are still in a solid short term bull move. The price is above its positive sloping moving average line (15 DMAw) and the short term momentum (13 Day RSI) is still comfortably in the positive zone. In fact the momentum has once again entered its overbought zone. The more aggressive Stochastic Oscillator continues in its overbought zone. All is still bullish but on very shaky ground. Both momentum indicators appear to be turning downward once more. A move below their overbought lines would be an indication of serious weakening of the price trend. Although, based upon the indicators, the short term must still be rated as BULLISH one should not ignore the warnings of a possible reversal of trend that might be taking place.
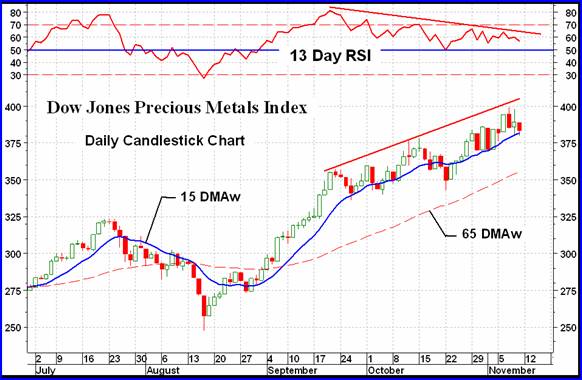
NORTH AMERICAN GOLD INDICES
Today's major gold Index is the Dow Jones Precious Metals Index. The most distinctive feature of the Index chart is the continuing weakening of the momentum indicator as the Index continues to move higher and higher. A clear warning that either the Index needs to get a lot stronger or the momentum will rule and pull the Index lower. Although not yet negative the short term momentum (shown) is very close to going negative. This, along with a move by the Index below its short term moving average line would then signal a short term reversal of trend.
MERV'S PRECIOUS METALS INDICES
Once again the strength, what there was of it, was in the silver Indices. Silver once again out performed gold this past week. Of the gold Indices, the strength was to the higher quality while the lower quality had a bad week. This is not a sign of a strong market but one that says speculators are not comfortable yet with the up side.
The Composite Index of Precious Metals Indices made a new all time high this past week thanks to the Johannesburg Gold Index, silver bullion and the FTSE Africa Index. The Composite has been on a real strong rally ever since hitting its low in Aug. All indicators are positive and there is no immediate threat to a change of direction. We'll just have to be on guard.
MERV'S GOLD & SILVER 160 INDEX
Overall the universe of 160 stocks closed the week on the down side by 2.1%. This was mostly due to the poorer performance of the speculative stocks. In total there were 63 winning stocks (39%) and 94 losing stocks (59%). The performance places the majority of the individual stocks in a transition position with the summation of individual ratings below the 50% mark for both the BULL and BEAR for the short term. On the intermediate term we still have a majority bullish with a summation rating of BULL 71%. On the long term we are also still in the plus side with a summation rating of BULL 69%. Despite some caution noted in the activity we are therefore still in a bullish mode as far as the majority of stocks are concerned. But we will have to watch how that short term progresses.
All of the indicators are positive for the intermediate and long term. The ratings remain BULLISH for both periods.
MERV'S QUAL-GOLD INDEX : MERV'S SPEC-GOLD INDEX : MERV'S GAMB-GOLD INDEX
The Qual-Gold Index was the only winner this week in these three sectors. The Gamb-Gold Index was the biggest loser with the Spec-Gold in between. Looking at the charts for these Indices the Qual-Gold Index is quite some distance into new high territory, the Spec-Gold Index is in new high territory but not to the degree that the Qual Index is. The Gamb-Gold Index is struggling to get into new highs and this week fell back below its previous earlier 2007 highs. An indication that the speculator interest is not yet fully into the real speculative stocks. As for the winners and loser count, the Qual had 17 winners and 13 losers, the Spec had 8 winners and 22 losers and the Gamb had 10 winners and 20 losers.
As for the summation of ratings, the Qual-Gold Index ratings are still all on the bullish side with the short term at a BULL 65%, intermediate term a BULL 93% and long term a BULL 90%.
The Spec-Gold Index has the short term as a BEAR 57%, the intermediate term as a BULL 53% and long term as BULL 65%.
The Gamb-Gold Index has the short term as NEUTRAL with neither bear or bull, the intermediate term has BULL 87% and the long term has a BULL 90% rating. The disconnect between these very high intermediate and long term ratings versus the “struggling” Index is the fact that the ratings take into account the actions of the individual stocks for their appropriate time period while the stocks themselves were not included into the Index until a week ago. The Index does not reflect a supper performance of these 30 component stocks over the previous several weeks.
Despite the poor performance of the Gamb-Gold Index, all three Indices have their various indicators in the positive zones. For both the intermediate and long term they can all be rated as BULLISH.
SILVER
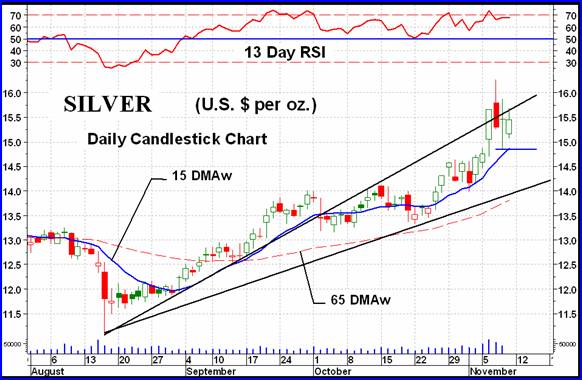
We see the negative Wednesday action clearer here in the silver chart. It started the day on the up side but quickly reached its peak and then it was downhill the rest of the day with a close at just about its low for the day. The next two days silver basically went nowhere, either up or down. It does look like it's setting itself up for a short term reversal, probably back to the second FAN trend line which could be seen as a support line at this time. A short term reversal would not, however, be confirmed until the short term momentum indicators goes into its negative zone and the price drops below its moving average line. Both might occur on a move below the $15 level.
MERV'S QUAL-SILVER INDEX : MERV'S SPEC-SILVER INDEX
Both silver Indices closed on the up side this past week. The Spec-Silver had the better performance with a gain of 3.3%, the best of the various Merv's Indices. This performance also shows up in the advancing/declining issues. The Spec Index had 17 winners for 68% and 6 losers at 24%. The Qual Index had a 40/60 win/loss ratio. With a positive week last week and another this week the summation of ratings for all three time periods for both Indices are in the BULL side. The indicators are also all on the positive side for the intermediate and long term. Both Indices are therefore rated as BULLISH for both time periods.
Merv's Precious Metals Indices Table
That's it for this week.
By Merv Burak, CMT
Hudson Aero/Systems Inc.
Technical Information Group
for Merv's Precious Metals Central
Web: www.themarkettraders.com
e-mail: merv@themarkettraders.com
For DAILY Uranium stock commentary and WEEKLY Uranium market update check out my new Technically Uranium with Merv blog at www.techuranium.blogspot.com .
During the day Merv practices his engineering profession as a Consulting Aerospace Engineer. Once the sun goes down and night descends upon the earth Merv dons his other hat as a Chartered Market Technician ( CMT ) and tries to decipher what's going on in the securities markets. As an underground surveyor in the gold mines of Canada 's Northwest Territories in his youth, Merv has a soft spot for the gold industry and has developed several Gold Indices reflecting different aspects of the industry. As a basically lazy individual Merv's driving focus is to KEEP IT SIMPLE .
To find out more about Merv's various Gold Indices and component stocks, please visit www.themarkettraders.com and click on Merv's Precious Metals Central . There you will find samples of the Indices and their component stocks plus other publications of interest to gold investors. While at the themarkettraders.com web site please take the time to check out the Energy Central site and the various Merv's Energy Tables for the most comprehensive survey of energy stocks on the internet. Before you invest, Always check your market timing with a Qualified Professional Market Technician
Merv Burak Archive |
© 2005-2022 http://www.MarketOracle.co.uk - The Market Oracle is a FREE Daily Financial Markets Analysis & Forecasting online publication.