


Why the FOMC Interest Rate Doves Have an Advantage at the April Meeting
Interest-Rates / US Interest Rates Apr 14, 2011 - 02:52 AM GMTBy: Asha_Bangalore

 Economic recessions have differences and similarities. In terms of the duration and depth of a recession, the most recent downswing in economic activity is a close cousin of the 1981-82 recession, which lasted 16 months. During this recession, real GDP fell 2.6% from peak to trough and the unemployment rate shot up to 10.8% by December 1982. The most recent recession is 18 months long, real GDP has dropped 4.1% from peak to trough, and the unemployment rate hit a high of 10.1% in October 2009.
A notable difference between the two downswings in economic activity is that the 1981-82 recession was not weighed down by a financial debacle as has been the case this time around. Tracking the economic recovery in these two time periods yields significant differences that monetary policymakers should note.
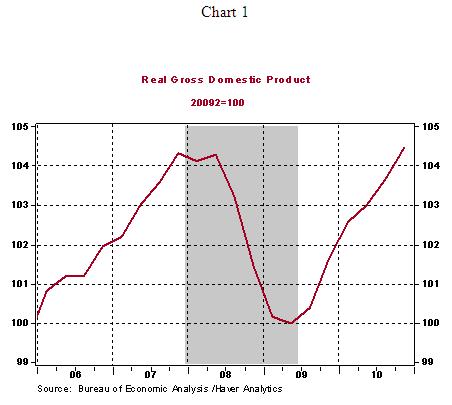
First, real GDP has increased only 4.5% from between 2009:Q2 and 2010:Q4 (see Chart 1). Chart 1 is an index chart with real GDP of 2009:Q2 set equal to 100.
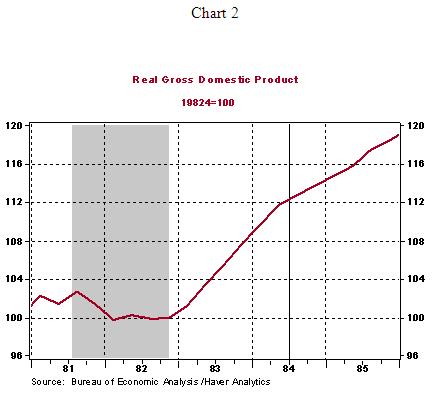
Moving back in time, real GDP grew a hefty 11.7% after six quarters of economic recovery following the 1981-82 recession which ended in November 1982 (see Chart 2). Chart 2 is also an index chart with real GDP set equal =100 at the trough of the 1982 recession. As charts 1 and 2 indicate, the current recovery is significantly tepid.
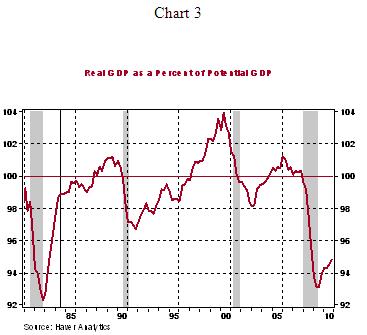
Alternatively, a comparison between actual and potential real GDP can be made to establish that the amount of slack in the economy at the present time is notably larger than at a similar stage of economic recovery after the 1982 recession . Real GDP is 94.5% percent of potential GDP in 2010:Q4 vs. a 98.7% reading in 1984:Q2. Charts 1-3 stress that the pace of economic growth during the current recovery has been woefully inadequate to make a large dent in the jobless rate.
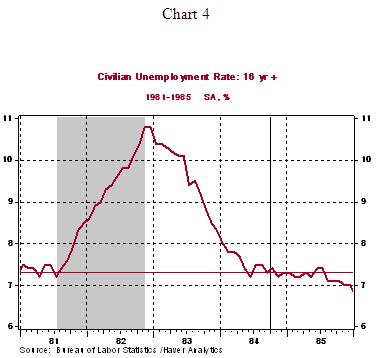
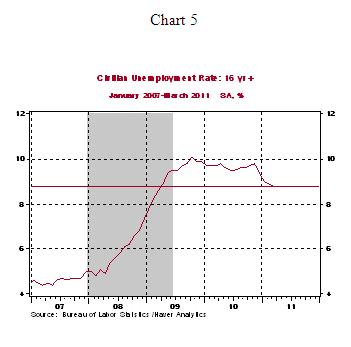
Second, reflecting the sub-par pace of economic activity, the unemployment rate has failed to post a big decline in the current recovery compared with the situation in post-1982 period (see Chart 4 and 5). The unemployment rate peaked at 10.8% in December 1982 and declined to 7.3% by September 1984, that is seven quarters from the trough. In the current recessionary experience, the jobless rate has peaked at 10.1% in October 2009 and it stood at 8.8% in March 2011, which is also seven quarters after the trough of the recession.
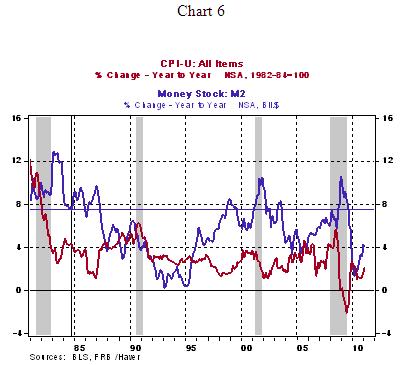
Third, for the hawks of the FOMC, who cite brewing inflationary pressures as a reason to step back from the financial accommodation in place, money supply is growing at a benign pace of around 4.0% currently where as the growth rate was closer to 7.5% in September 1984. The Consumer Price Index increased 2.1% in March 2011 from a year ago, while it was hovering around 4.0% in 1984. If money supply is an important indicator of inflationary pressures, current data are not supportive of imminent inflation and actual inflation readings are contained, for now.
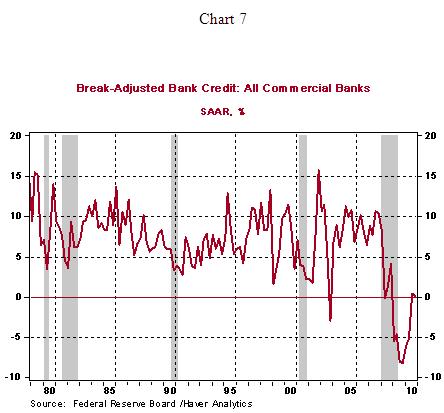
Fourth, bank credit is currently showing a flat trend (Data points stop at 2010:Q4 in Chart 7. Numbers for 2011:Q1 will be published later in the week). By contrast, bank credit was expanding around at a 10% pace after seven quarters into the recovery during 1984.
There are differences of opinion among members of the FOMC that have emerged in speeches of several Fed officials in recent weeks. A line is being drawn between those who favor the Fed's current accommodative monetary policy and those who are supportive of policy actions to curb demand and contain future inflationary pressures. Based on evidence present here, the doves appear to have a strong advantage at the April 26-27 FOMC meeting to stay the course and complete the $600 billion asset purchase and watch the evolution of economic conditions.
Asha Bangalore — Senior Vice President and Economist
http://www.northerntrust.com
Asha Bangalore is Vice President and Economist at The Northern Trust Company, Chicago. Prior to joining the bank in 1994, she was Consultant to savings and loan institutions and commercial banks at Financial & Economic Strategies Corporation, Chicago.
Copyright © 2011 Asha Bangalore
The opinions expressed herein are those of the author and do not necessarily represent the views of The Northern Trust Company. The Northern Trust Company does not warrant the accuracy or completeness of information contained herein, such information is subject to change and is not intended to influence your investment decisions.
© 2005-2022 http://www.MarketOracle.co.uk - The Market Oracle is a FREE Daily Financial Markets Analysis & Forecasting online publication.