Oil Services Stocks Correction Due?
Commodities / Oil Companies Apr 21, 2011 - 05:33 AM GMTBy: Dian_L_Chu
 Michael Tarsala writes: Oil services stocks are seeing downside earnings revisions and bearish options bets ahead of earnings, and could be in danger of losing their price uptrend, according to a Thomson Reuters technical signal.
The options positioning suggest there’s a lot less optimism for services versus drillers and refiners, and less hope they’ll have another blockbuster quarter.
Bearish bets started to pile up right before the earnings release for the Oil Service HOLDR’s ETF (OIH), which counts Schlumberger (SLB), Halliburton (HAL) and Baker Hughes (BHI) among its components. There were 10,000 May $140 puts purchased on Tuesday, April 12 on roughly twice average volume. It’s seemingly a bet that the fund would retreat at least another 10% following first-quarter earnings.
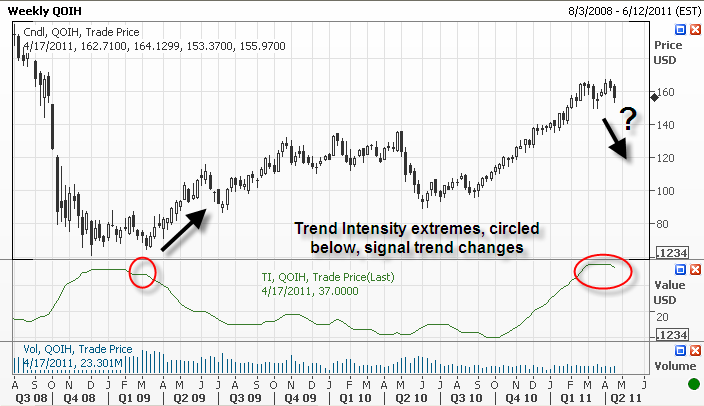
The OIH derivatives trades coincided with a Thomson Reuters Trend Intensity signal that suggests the potential end of a 60% run since September.
The Trend Intensity is the indicator you see at the bottom of this chart:

The indicator, a tool used by many technical analysts, has now provided its first “ended trend” sign for the OIH since February 2009, helping to signal a buy point following a swoon that cut the OIH by more than half.
Halliburton and Schlumberger are both on the docket to report earnings the week of April 17. There are no widespread calls for either to post big earnings misses.
That said, analysts have scaled back their expectations for each by about 6% in the past month. It’s one reflection that there is less optimism for a Q4 redux where Halliburton and Schlumberger beat estimates by 7% and 10%, respectively, and rival Baker Hughes beat by 30%, marking one of the strongest S&P 500 earnings surprises.
There were several pressures on the services sector in the first quarter. Unseasonably cold weather in the United States and North Africa likely stalled some projects in the quarter. Deepwater projects in the Gulf of Mexico continue to be approved very slowly, following last year’s disastrous BP spill. And oil’s 5% tumble from year highs in early April have coincided with the group’s decline.
As a result, earnings sentiment appears to be waning. Estimates for the 14 largest services companies are down 5% in the past 30 days. In contrast, estimates for all energy stocks are up 7%, reflecting a stronger bias for drillers and refiners.
The predicted Q1 earnings surprise for the oil services group is 2% below mean estimates vs. 2% above mean for U.S. energy stocks as a whole. Even if oil services earnings are better than expected, oil services could lag crude’s bullish move going forward.
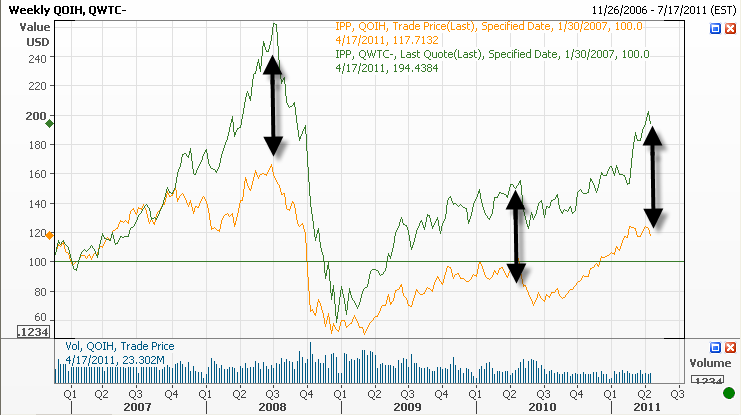
One signal helping to mark oil services extremes is its price gap with crude. When a crude price rebased to early 2007 outperforms the OIH by more than 50%, it has helped to signal the 2008 market top and the April 2010 top for both crude and the services ETF. For a third time, the current gap between crude and oil services has reached the 50% threshold.

Now, if both were to fall hard here, there's a pair trade argument to be made.
Yet, the unrest in the Middle East simply makes it unlikely that oil will drop below $100 -- even with ample supply. So if oil continues to climb in coming weeks, the current performance gap between oil and services could continue to widen.
Even with OK earnings.
(Watch Michael here in person sharing his insight regarding oil services stocks.)
Dian L. Chu, M.B.A., C.P.M. and Chartered Economist, is a market analyst and financial writer regularly contributing to Seeking Alpha, Zero Hedge, and other major investment websites. Ms. Chu has been syndicated to Reuters, USA Today, NPR, and BusinessWeek. She blogs at http://www.econmatters.com/.
© 2011 Copyright Dian L. Chu - All Rights Reserved Disclaimer: The above is a matter of opinion provided for general information purposes only and is not intended as investment advice. Information and analysis above are derived from sources and utilising methods believed to be reliable, but we cannot accept responsibility for any losses you may incur as a result of this analysis. Individuals should consult with their personal financial advisors.
© 2005-2022 http://www.MarketOracle.co.uk - The Market Oracle is a FREE Daily Financial Markets Analysis & Forecasting online publication.


