Silver Top or Not?
Commodities / Gold and Silver 2011 Apr 27, 2011 - 03:18 AM GMT When gold hit the psychologically important $1,500 level it didn't surprise us, but we admit that silver’s recent performance gave us a small thrill. Before jumping into the chart analysis, let’s have a look into the factors that contributed to metals’ spectacular rally over the past couple of weeks.
For the first time in its history the U.S.'s perfect AAA credit rating was downgraded, and for the first time in history, gold hit the $1,500-an-ounce mark. Also, the news over the week end of a $1 billion gold bullion purchase by one of the largest college endowment funds sent a strong message about gold’s re-emergence as a respected, legitimate asset class.
Now that gold futures have traded above the psychologically important $1,500 level, some are wondering if gold's trajectory will continue or slow down. It is interesting to notice how the two biggest holders of U.S Treasury securities reacted to the news. Japan downplayed concerns about the creditworthiness of the U.S. giving Treasuries a vote of confidence, while China didn't even try to veil its worry. “We hope the US government will take responsible policies and measures to safeguard investors’ interests,” said China's foreign minister. China has plenty of reasons to be worried. It is the largest foreign owner of US Treasuries with $1,154.1bn. in US Treasuries ahead of Japan’s $890.3bn. The Federal Reserve is the largest overall holder of US Treasuries with $1,368bn on its books. The sheer size of China’s reserves means there are no other asset markets in the world large or liquid enough (certainly not gold) for China to stash its increasing cash pile.
As the United States and Europe struggle to get their economies rolling again, China is having the opposite problem: figuring out how to keep its revved-up growth engine from generating runaway inflation.
The latest sign that things are overheating came when China’s central bank ordered the biggest banks to set aside more cash reserves to reduce the amount of money available for loans. This is an attempt to cool down the economy. It follows the announcement on Friday that China’s economy was growing at an annual rate of 9.7 percent, by far the strongest performance by any of the world’s biggest economies. It goes without saying that money problems in China can reverberate loud and clear the world over. High inflation endangers China’s status as the world's low-cost workshop for the world. The only tool central banks have to fight inflation is to rate key interest rates, something they have to do very carefully so as not choke off growth. But the difficult part is that inflation is rising faster than interest rates creating a perpetual negative real interest rate environment (interest rate minus inflation), which means your dollar in the bank is worth less. As paper currencies lose value, gold shines brightly as a store of wealth.
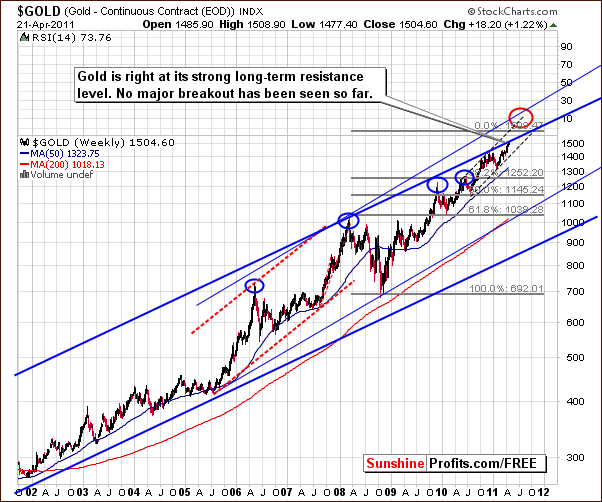
Still, let’s keep in mind that fundamental factors, as the ones mentioned above drive markets in the long term, but emotions determine the short-term outcome. Consequently, it’s of utmost importance to supplement fundamental knowledge with proper chart analysis. Today we will feature two important charts. Let’s start with the long-term gold chart (charts courtesy by http://stockcharts.com.)

Considering the recent performance, gold’s price has risen significantly, but, more importantly, gold has reached the $1,500 target level we have been writing about for several weeks now. This is an important resistance level, but the most important one is the upper border of the rising trend channel (marked with thick blue line).
A general rule of thumb regarding major long-term breakouts is that they should be visible here in the very long-term chart (that’s a rough approximation of the three-consecutive-trading-days-above-the-line rule). As you can see, gold appears to have reached this resistance line. The situation is tense at this time and will remain so until gold moves decisively either to higher price levels or back below the $1,500 level.
Overall, two resistance lines are in play and we are roughly few dollars away from our target level in spot gold. Extreme caution should be exercised at this time. Still, at this point it seems that the emphasis should not be put on the analysis of gold, but on silver. In this essay we will examine the situation in silver through the silver:gold ratio.

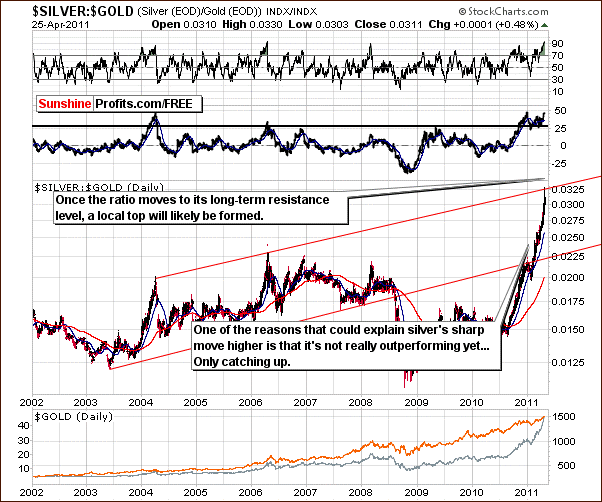
In the Silver:Gold ratio chart, we begin with a look back to what was stated in our Premium Update April 15th 2011. We said that the ratio has not yet reached the very long-term resistance line. This upper border of the trading channel (marked with red) will likely be the point at which the ratio reaches its next local top. This will serve as a confirmation that once this resistance line is reached, the short-term rally for silver and gold will likely end.
About two weeks ago, the Silver:Gold ratio was in the middle of the trading range. Since that time, silver has clearly outperformed gold and the ratio has quickly approached the upper border of the trading channel. The speed in which this took place was unexpected and has likely brought us closer to the end of the current rally more quickly than seemed probable. Is the current rally in silver over? The situation is quite complicated and has different implications for Traders and Investors, however we believe the top for this rally is most likely in.
As we’ve mentioned before, the above ratio is likely the key to properly timing the gold and silver markets at the current juncture and the key target – upper border of the rising trend channel – has been reached.
Summing up, the past eight months have seen a virtually meteoric rise in silver’s price, but it seems that the white metals and also the rest of the precious metals sector have already begun its corrective phase.
To make sure that you are notified once the new features are implemented, and get immediate access to my free thoughts on the market, including information not available publicly, we urge you to sign up for our free e-mail list. Gold & Silver Investors should definitely join us today and additionally get free, 7-day access to the Premium Sections on our website, including valuable tools and unique charts. It's free and you may unsubscribe at any time.
Thank you for reading. Have a great and profitable week!
P. Radomski
Editor
Sunshine Profits
Interested in increasing your profits in the PM sector? Want to know which stocks to buy? Would you like to improve your risk/reward ratio?
Sunshine Profits provides professional support for precious metals Investors and Traders.
Apart from weekly Premium Updates and quick Market Alerts, members of the Sunshine Profits’ Premium Service gain access to Charts, Tools and Key Principles sections. Click the following link to find out how many benefits this means to you. Naturally, you may browse the sample version and easily sing-up for a free trial to see if the Premium Service meets your expectations.
All essays, research and information found above represent analyses and opinions of Mr. Radomski and Sunshine Profits' associates only. As such, it may prove wrong and be a subject to change without notice. Opinions and analyses were based on data available to authors of respective essays at the time of writing. Although the information provided above is based on careful research and sources that are believed to be accurate, Mr. Radomski and his associates do not guarantee the accuracy or thoroughness of the data or information reported. The opinions published above belong to Mr. Radomski or respective associates and are neither an offer nor a recommendation to purchase or sell securities. Mr. Radomski is not a Registered Securities Advisor. Mr. Radomski does not recommend services, products, business or investment in any company mentioned in any of his essays or reports. Materials published above have been prepared for your private use and their sole purpose is to educate readers about various investments.
By reading Mr. Radomski's essays or reports you fully agree that he will not be held responsible or liable for any decisions you make regarding any information provided in these essays or reports. Investing, trading and speculation in any financial markets may involve high risk of loss. We strongly advise that you consult a certified investment advisor and we encourage you to do your own research before making any investment decision. Mr. Radomski, Sunshine Profits' employees and affiliates as well as members of their families may have a short or long position in any securities, including those mentioned in any of the reports or essays, and may make additional purchases and/or sales of those securities without notice.
Przemyslaw Radomski Archive |
© 2005-2022 http://www.MarketOracle.co.uk - The Market Oracle is a FREE Daily Financial Markets Analysis & Forecasting online publication.


