Rally Expected in Goldman Sachs
Companies / Company Chart Analysis May 04, 2011 - 02:08 AM GMTBy: Mike_Paulenoff
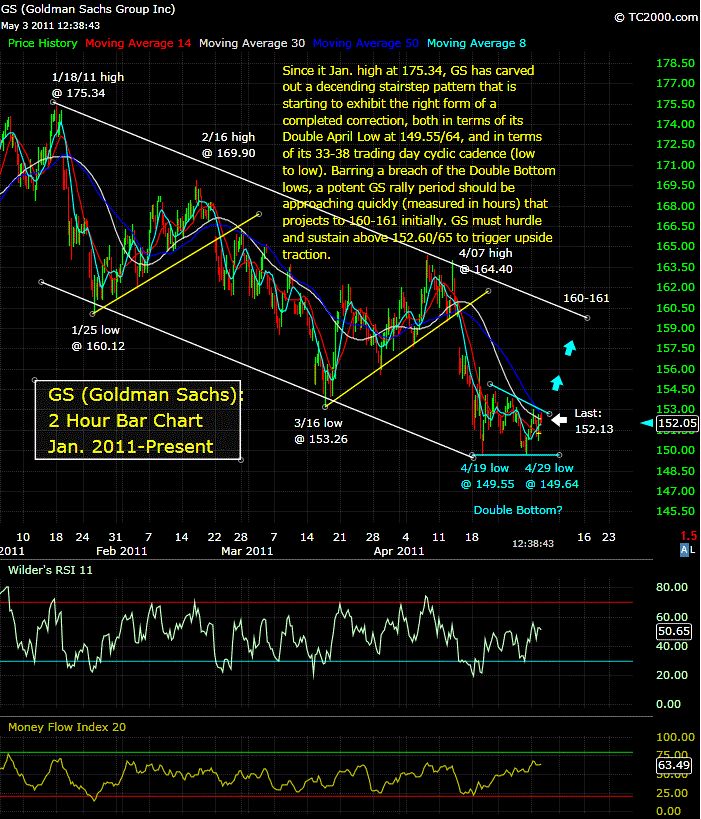
Since its January high at 175.34, Goldman Sachs (GS) has carved out a descending stairstep pattern that is starting to exhibit the right form of a completed correction, both in terms of its double April low at 149.55/64 and in terms of its 33-38 trading day cyclic cadence (low to low).
Barring a breach of the double bottom lows, a potent GS rally period should be approaching quickly (measured in hours) that projects to 160-161 initially.
GS must hurdle and sustain above 152.60/65 to trigger upside traction.

Sign up for a free 15-day trial to Mike's ETF & Stock Trading Diary today.
By Mike Paulenoff
Mike Paulenoff is author of MPTrader.com (www.mptrader.com), a real-time diary of his technical analysis and trading alerts on ETFs covering metals, energy, equity indices, currencies, Treasuries, and specific industries and international regions.
© 2002-2011 MPTrader.com, an AdviceTrade publication. All rights reserved. Any publication, distribution, retransmission or reproduction of information or data contained on this Web site without written consent from MPTrader is prohibited. See our disclaimer.
Mike Paulenoff Archive |
© 2005-2022 http://www.MarketOracle.co.uk - The Market Oracle is a FREE Daily Financial Markets Analysis & Forecasting online publication.


