Silver Investors Shock and Horror, Where Next?
Commodities / Gold and Silver 2011 May 08, 2011 - 10:04 AM GMTBy: Clive_Maund
 Silver newbies discovered to their shock and horror last week that silver can actually go down as well as up, and even worse, that it drops a lot faster than it goes up. We were partly fooled ourselves last week by the seemingly bullish COT figures, but not to the extent that it stopped us implementing protection in the form of Puts, or Calls in silver bear ETFs such as ZSL.
After last week's devastating plunge the silver battlefield is littered with the corpses of silver longs, with those who are still breathing being exhorted to "put their shoulder to the wheel" again by undismayed silver cheerleaders, who are hailing a "fantastic buying opportunity" for the ride of a lifetime. Is it?? - let's see what the charts have to say...

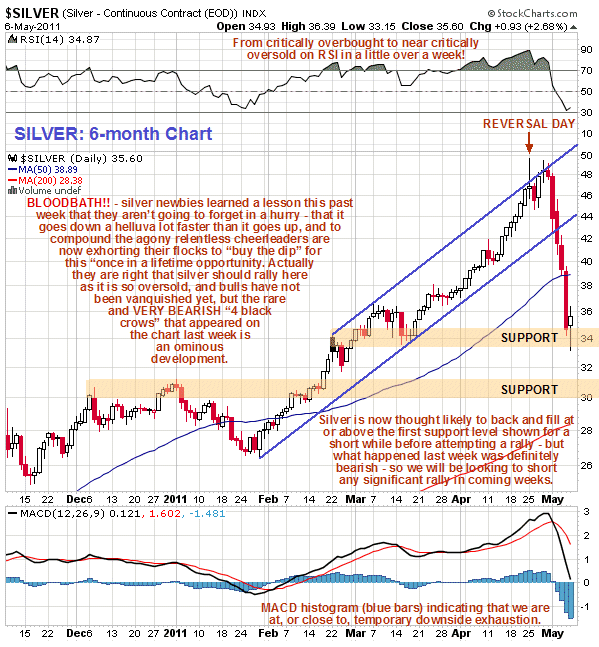
On its 6-month chart we can see that after hitting the top of its intermediate trend channel in the high $40's, where it showed signs of running into trouble that we will look at in more detail on a one-month chart, silver suddenly turned tail and plunged, crashing through the lower support line of the channel as if it wasn't there. This near vertical plunge took the form of a rare and very bearish "4 Black Crows" that we will also delineate on the one-month chart. By Friday silver had gotten deeply oversold and the steep downtrend paused at the support level shown, with a more bullish long-tailed candlestick appearing on the chart. The cheerleaders are certainly right that silver is now short-term oversold, and some sort of rally looks likely soon, probably after some choppy action near the upper support level on our chart - and it could drop even lower towards the lower support level shown and its 200-day moving average before a significant rally occurs.
Should such a rally get going it will of course be hailed by the cheerleaders as the "start of the big one" and it could be if the dollar tanks, but what concerns us is the bearish 4 Black Crows" candlestick pattern that occurred last week, which portends a more prolonged and severe decline - possibly even a bearmarket. Yet how can that be? - isn't the Fed's reckless and relentless money printing and zero interest rate policy pushing the dollar ever close to the abyss and the US towards hyperinflation. Yes it is, but do you think the Fed doesn't know that? These people should not be underestimated - keep in mind that they engineered a financial system which essentially turned the rest of the inhabitants of this planet into servants of the United States, with their reserve currency status for the US dollar, and have cajoled the rest of the world into handing over its savings to be used to support a sumptuous standard of living in the US and a big miliary to police the globe in furtherance of US interests. So put yourself in their shoes now and imagine that you are faced with a collapse of both the US dollar and the Treasury market - what's the best way to prop up both and buy some time? Give you a clue - think 2008. Got it yet? - well in case you haven't I'll spell it out for you...
With its back to the wall everyone expects the Fed to wheel out QE3 in a timely manner. If they don't what will happen? - the first thing that will happen is the threat of higher interest rates will cause the commodity markets and stockmarkets to tank - and where will the liberated funds go? - into the dollar and Treasuries of course, not because they are good investments, but because most investors and fund managers are too dumb and unoriginal to think of anything else. Commodities and stocks have not been going up because of economic recovery because there is no real economic recovery, much less because of genuine demand for end use - they have been going up because of the huge leverage employed in these markets by speculators, who have been borrowing money at zero or near zero rates and turning round and pyramiding speculative positions, as set out by smooth talking Karl Denninger in his timely article But It's All Money Printing .
As soon as these markets percieve a threat to the supply of cheap money they will tank and the drop will be magnified by margin calls against hordes of distressed speculators. The Fed can quickly achieve this result by making noises to the effect that it is not going to do QE3, and then do it anyway a little later to save its cronies in the big Wall St banks from the threatening consequences of a derivatives implosion. When they do QE3 after all, the commodities and stocks roadshow can get rolling again. Just imagine how much money will be made by the elites who are in on this game plan - it certainly helps to know which big levers are going to be pulled and when. We don't that this is going to happen for sure of course, it is a hypothesis, but the first whiff of it would certainly explain the bearish action in commodities last week.

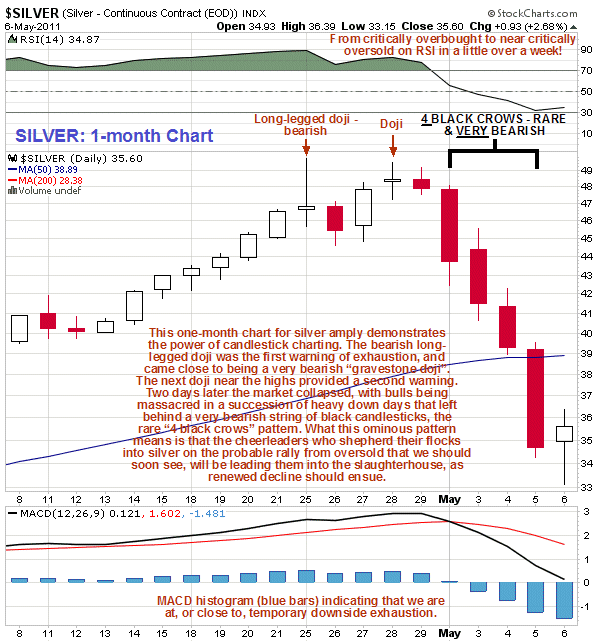
Getting back to the charts we will now look at recent action in silver in more detail on a 1-month chart. This chart demonstrates the power and utility of candlestick charting, for on it we can see clear warnings of an imminent reversal occurring very close to the highs, which is why we took defensive measures such as buying Puts, and Calls in bear ETFs, to protect open long positions in silver. For as we can see two pronounced dojis formed during the weeks of the top. Dojis are where the open and close for the day occur almost at the same level and indicate a condition of stalemate, which, occurring after a long runup, often precedes a reversal. Last week we saw 4 heavy down days in succession, with the price opening near the previous day's close and falling heavily to close not far from its lows for the days. When you see 3 such days in succession it is known as "3 Black Crows" and it is bearish in purport, as it is a sign of heavy and determined selling. Four such down days in succession, "4 Black Crows" are much rarer and correspondingly more bearish. However, by completion of the 4th day, bearish or not, the market has obviously dropped a lot and become heavily oversold short-term, so it shouldn't be chased down - what normally happens is a relief rally that often retraces about half of the drop before renewed decline to lower lows sets in. So you might want to keep this in mind as the cheerleaders become more vocal on a bounce in coming days/weeks.

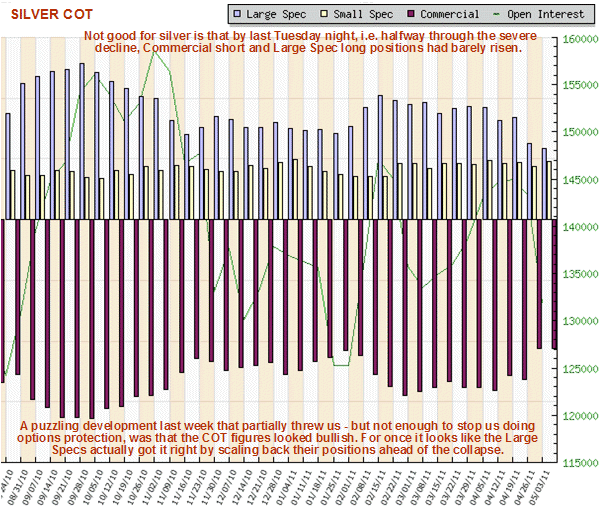
What about the latest COT chart? As mentioned in the opening paragraph we were thrown somewhat last week by the bullish looking COT chart, but the COTs didn't save silver which plunged, bullish COT or not. The latest COT chart looks a lot less bullish than the one last week. This is because despite silver having fallen heavily for 2 days by last Monday's close, the Commercial short and Spec long positions had barely moved, and we would have expected them to decrease significantly if silver was set to reverse to the upside soon. So on the basis of these erratic indications, we are going to attatch somewhat less importance to the COT figures for silver going forward, especially after them being grossly misleading last weekend.
By Clive Maund
CliveMaund.com
For billing & subscription questions: subscriptions@clivemaund.com
© 2011 Clive Maund - The above represents the opinion and analysis of Mr. Maund, based on data available to him, at the time of writing. Mr. Maunds opinions are his own, and are not a recommendation or an offer to buy or sell securities. No responsibility can be accepted for losses that may result as a consequence of trading on the basis of this analysis.
Mr. Maund is an independent analyst who receives no compensation of any kind from any groups, individuals or corporations mentioned in his reports. As trading and investing in any financial markets may involve serious risk of loss, Mr. Maund recommends that you consult with a qualified investment advisor, one licensed by appropriate regulatory agencies in your legal jurisdiction and do your own due diligence and research when making any kind of a transaction with financial ramifications.
Clive Maund Archive |
© 2005-2022 http://www.MarketOracle.co.uk - The Market Oracle is a FREE Daily Financial Markets Analysis & Forecasting online publication.


