Investors Don’t Turn Out the Lights on Commodities Just Yet
Commodities / Commodities Trading May 10, 2011 - 01:59 AM GMTBy: Frank_Holmes
 The prices for many commodities suffered the worst week in recent memory last week. Oil prices dipped below $100 per barrel, gold fell below $1,500 an ounce and silver gave back much of the past month’s gains by falling to the $35 an ounce level. The prices for other commodities such as sugar, tin, nickel, aluminum, lead and copper also pulled back.
 Immediately, headlines on websites such as Marketwatch, Bloomberg and SmartMoney read “Has the Commodity Bubble Popped?” and “Imploding Commodities Complex.”
Is this the end? Has the great bull run for commodities come to an end?
In our opinion, not likely.
First of all, we wrote on April 24 that commodity prices were due for a pullback (Read: Don’t Fear a Pullback in Prices). Specifically, we pointed out that silver had wandered into “extreme” territory which exacerbated the reversal we saw this week.
On May 3 (before we saw the largest declines), BCA Research wrote “one look at the hyperbolic rise in silver prices should be sufficient to convince even a hardcore commodity bull that things are getting frothy.”
In fact, the silver trade had gotten so far ahead of itself, the iShares Silver Trust ETF was “the most highly traded security on the planet,” according to our friend Tom Lydon over at ETF Trends. Last week’s selloff was less of an end to the bull market and more a function of “stampeding speculators” (to borrow a line from Sarah Turner at Marketwatch) rushing for the exits.
But short-term speculators aren’t the only factor; last week’s strength in the U.S. dollar was just as much a facilitator of the price declines. The U.S. dollar found additional strength on Thursday after Jean-Claude Trichet, president of the European Central Bank (ECB), said the ECB would not raise rates until after June. By week’s end, the U.S. dollar was up 2.5 percent for the week, a pretty big move.
In addition, we entered the month of May which has historically proven to be a weak and volatile period for commodities. With the Federal Reserve set to wind down its quantitative easing (QE2) program by the end of next month, it’s possible we could continue to see volatility for a little while.
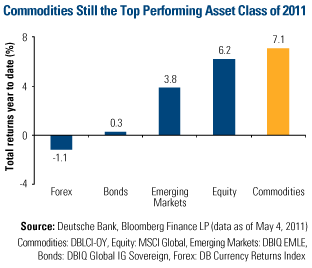
Despite the selloff, commodities were still the year’s top performing asset class as of Thursday. You can see from the chart that the year-to-date return for commodities has far outpaced the return for foreign exchange, bonds and emerging markets.

Looking out on the horizon, very little has changed for the long-term bull case for commodities. The U.S. is still struggling to come up with a feasible solution to its multi-trillion dollar debt problem. Emerging markets are still seeing incremental increases in demand for nearly all commodities. And, the reserves for many commodities are still struggling to keep pace with this demand.
Essentially, what happened last week was more of a “technical correction” than a fundamental shift in the long-term dynamics for commodities and we’ve already begun this week with big gains for silver and crude oil prices.
The party’s not over for commodities, so don’t turn out the lights just yet. While it’s impossible to predict the future, we think in a month or two investors may look back and see this downdraft as a good buying opportunity.
For more updates on global investing from Frank and the rest of the U.S. Global Investors team, follow us on Twitter at www.twitter.com/USFunds or like us on Facebook at www.facebook.com/USFunds. You can also watch exclusive videos on what our research overseas has turned up on our YouTube channel at www.youtube.com/USFunds.
Please consider carefully the fund's investment objectives, risks, charges and expenses. For this and other important information, obtain a fund prospectus by visiting www.usfunds.com or by calling 1-800-US-FUNDS (1-800-873-8637). Read it carefully before investing. Distributed by U.S. Global Brokerage, Inc.
Standard deviation is a measure of the dispersion of a set of data from its mean. The more spread apart the data, the higher the deviation. Standard deviation is also known as historical volatility. All opinions expressed and data provided are subject to change without notice. Some of these opinions may not be appropriate to every investor. The S&P 500 Stock Index is a widely recognized capitalization-weighted index of 500 common stock prices in U.S. companies. The NYSE Arca Gold BUGS (Basket of Unhedged Gold Stocks) Index (HUI) is a modified equal dollar weighted index of companies involved in gold mining. The HUI Index was designed to provide significant exposure to near term movements in gold prices by including companies that do not hedge their gold production beyond 1.5 years. The MSCI Emerging Markets Index is a free float-adjusted market capitalization index that is designed to measure equity market performance in the global emerging markets. The U.S. Trade Weighted Dollar Index provides a general indication of the international value of the U.S. dollar.
Frank Holmes Archive |
© 2005-2022 http://www.MarketOracle.co.uk - The Market Oracle is a FREE Daily Financial Markets Analysis & Forecasting online publication.


