


Why Economic Growth is Dead
Economics / US Economy May 13, 2011 - 02:33 AM GMTBy: Dr_Martenson

 John Rolls Submits: The end of the second round of quantitative easing (QE II) is going to be a complete disaster for the paper markets -- specifically commodities, stocks, and then finally bonds, in that order, with losses of 20% to 50% by the end of October. The only thing that will arrest the plunge will be QE III, although we should remain alert to the likelihood that it will be named something else in an attempt to obscure what it really is. Perhaps it will be known as the "Muni Asset Trust Term Liquidity Facility" or the "American Prime Purchase Program," but whatever it is called, it will involve hundreds of billions of thin-air dollars being printed and dumped into the financial system.
A Premature Victory Lap
Bernanke recently stood at a lectern and announced to the assembled audience that the Fed's recent policies could be credited with elevated stock prices and an improved employment statistic while somehow keeping inflation low.
It was his own version of a 'mission accomplished' speech, just like the one G. W. Bush gave. Similarly, it does not mark the end of significant difficulties, but the probable beginning of a very long period of treacherous economic and financial disruption.
Here's one recent version of how the Fed's actions are being interpreted, courtesy of Bloomberg:
Bernanke’s QE2 Averts Deflation, Spurs Rally, Expands Credit
Ben S. Bernanke’s $600 billion strike against deflation is paying off, as stock and debt markets rise, bank lending grows and economists forecast faster growth.
The Standard & Poor’s 500 Index has gained 13.5 percent since the Federal Reserve chairman announced on Nov. 3 the plan to buy Treasuries through its so-called quantitative easing policy. Government bond yields show investors expect consumer prices to rise in line with historical averages. The riskiest companies are obtaining credit at the cheapest borrowing costs ever and Fed data show that commercial and industrial loans outstanding are rising for the first time since 2008.
“Looking at market indicators, you have to be convinced it’s been a success,” said Bradley Tank, chief investment officer for fixed-income in Chicago at Neuberger Berman Fixed Income LLC, which oversees about $83 billion. “When you get into periods of aggressive central bank easing, and we’re clearly in the most aggressive period of easing that we’ve ever seen, the markets tend to lead the real economy.”
A rising stock market, low inflation expectations, and lots and lots of cheap credit for even the riskiest companies. What's not to like?
The main problem is that this is all an illusion. If it were truly possible to print one's way to prosperity, history would have already proven that to be possible, yet such efforts have always failed. The reason is simple enough: Money is not wealth; it is a commodity that we use as a temporary store of wealth. Real wealth is the products and services that are made possible by an initial balance of high-quality resources that can be transformed by human effort and ingenuity.
For some reason, however, this basic concept has managed to elude the high priests and priestesses of the money temples throughout time. Somehow it always seems compelling to give money printing a try, maybe because this time seems different. But it never is. And it's not different this time, either.
Even as the markets are beginning to correct in anticipation of the end of QE II (which I predicted in my newsletters as early as March 8, 2011), we should note that the Fed is still pumping an average of $89 billion per month into the markets.
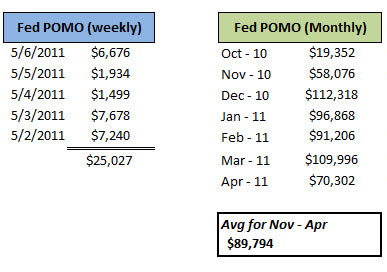
When we compare the $370 billion that the Fed has printed and placed into the financial system year-to-date against the levels of money flows going into and out of mutual funds, exchange-traded funds (ETFs), and money market funds, we observe that the Fed's actions swamp those flows by a factor of roughly 2:1. That is, the amount the Fed is putting in is quite significant, and its disappearance from the markets is something that needs to be carefully considered.
On the plus side, we can all be thankful for the one thing that money printing can do, and has done, which is buying a little more time for everyone. As I consistently advocate, such time should be used, at least in part, to ready oneself for a future of less and to become more resilient against whatever shocks are yet to come.
While money printing can so some wondrous things in the short term - (Hey, give me $2 trillion to spend and I'll throw a nice party, too!) - it cannot fix the predicament of fundamental insolvency. The United States has lived beyond its means for a couple of decades and promised itself a future that it forgot to adequately fund. The remaining choice is between accepting an unpleasant but relatively steady period of austerity leading to a new lower standard of living -- or a final catastrophe for the dollar. The former is akin to walking down around the side of a cliff, and the latter is jumping off.
Too Little Debt! (or, One Chart That Explains Everything)
If I were to be given just one chart, by which I had to explain everything about why Bernanke's printed efforts have so far failed to really cure anything and why I am pessimistic that further efforts will fall short, it is this one:
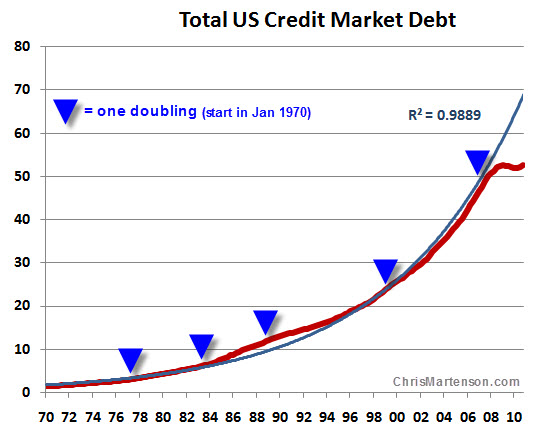
There's a lot going on in this deceptively simple chart so let's take it one step at a time. First, "Total Credit Market Debt" covers everything - financial sector debt, government debt (fed, state, local), household debt, and corporate debt - and is represented by the bold red line (data from the Federal Reserve).
Next, if we start in January 1970 and ask the question, "How long before that debt doubled and then doubled again?" we find that debt has doubled five times in four decades (blue triangles).
Then if we perform an exponential curve fit (blue line), we find a nearly perfect fit with an R2 of 0.99 when we round up. That means that debt has been growing in a nearly perfect exponential fashion through the 1970's, the 1980's, the 1990's and the 2000's. In order for the 2010 decade to mirror, match, or in any way resemble the prior four decades, credit market debt will need to double again from $52 trillion to $104 trillion.
Finally, note that the most serious departure between the idealized exponential curve fit and the data occurred beginning in 2008 -- and it has not yet even remotely begun to return to its former trajectory.
This explains everything.
It explains why Bernanke's $2 trillion has not created a spectacular party in anything other than a few select areas (banking, corporate profits) which were positioned to directly benefit from the money. It explains why things don't feel right, or the same, and why most people are still feeling quite queasy about the state of the economy. It explains why the massive disconnect between government pensions and promises, all developed and doled out during the prior four decades, cannot be met by current budget realities.
Our entire system of money, and by extension our sense of entitlement and expectations of future growth, were formed in response to and are utterly dependent on exponential credit growth. Of course, as you know, money is loaned into existence and is therefore really just the other side of the credit coin. This is why Bernanke can print a few trillion and not really accomplish all that much. It's because the main engine of growth is expecting, requiring, and otherwise dependent on credit doubling over the next decade.
To put that into perspective, a doubling will take us from $52 to $104 trillion, requiring close to $5 trillion in new credit creation during each year of that decade. Nearly three years have passed without any appreciable increase in total credit market debt, which puts us roughly $15 trillion behind the curve.
What will happen when credit cannot grow exponentially? We already have our answer, because that's been the reality for the past three years. Debts cannot be serviced, the weaker and more highly leveraged participants get clobbered first (Lehman, Greece, Las Vegas, housing, etc.), and the dominoes topple from the outside in towards the center. Money is piled on, but traction is weak. What begins as a temporary program of providing liquidity becomes a permanent program of printing money, which the system becomes dependent on in order to even function.
In addressing these questions in Part II of this report (Positioning For The Coming Rout), I have become increasingly confident that the Fed's efforts to exit quantitative easing will lead to a substantial market rout that will roil all asset classes this year. That's just the short-term outlook. Continued and eventually greater turbulence will result from the government's subsequent response.
Click here to access Part II (free executive summary; paid enrollment required to access) for specific predictions on what to expect in the months ahead as well as recommendations for protecting your wealth.
By Dr Martenson
© 2011 Copyright Dr Martenson - All Rights Reserved
Disclaimer: The above is a matter of opinion provided for general information purposes only and is not intended as investment advice. Information and analysis above are derived from sources and utilising methods believed to be reliable, but we cannot accept responsibility for any losses you may incur as a result of this analysis. Individuals should consult with their personal financial advisors.
© 2005-2022 http://www.MarketOracle.co.uk - The Market Oracle is a FREE Daily Financial Markets Analysis & Forecasting online publication.