


Significant Stock Market Correction In Progress Now
Stock-Markets / Stock Markets 2011 May 15, 2011 - 07:26 AM GMTBy: Steven_Vincent

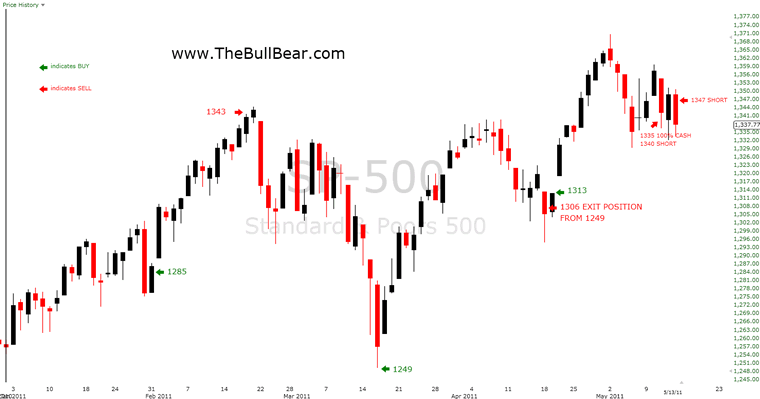
 I've been long SPX since the September 2010 bottom and an aggressive buyer on pullbacks. Today I exited all long trades and went to 100% cash and then even took on a small short position. My current analysis shows ample reason to conclude that stocks and commodities are in the early stages of a significant correction. Here's my SPX trading record for 2011:
I've just completed a review of recent mainstream and alternative financial media. Bears are virtually nonexistent. Almost no one is looking for any kind of a top at this time. For over two years, even the slightest sign of market weakness and every bit of bearish news has been greeted with a cascade of calls for the end of civilization. Apparently sentiment has turned fully bullish for the first time, just as the markets are signaling the potential for a deep pullback. The traders on CNBC Fast Money were completely unfazed by recent market action:
”The market feels vulnerable but it's felt vulnerable a number of times,” says Fast trader Guy Adami. Largely Adami and the other traders aren't terribly concerned by Wednesday's sell-off; they expect a bounce. "On the dip you can buy," says Pete Najarian. "I'm with Pete," echoes Joe Terranova.
And in an environment like this, the Fast Money traders always suggest looking for pockets of strength and putting money to work.
I had called for a Crude Oil, Silver and Commodities top and a temporary bottom the the Dollar to the very day and expected to see a significant correction over a period of weeks or months. But I was somewhat surprised by the ferocity of the market action. I'd been quite bullish on equities, as I said, and the commodities action caused me to reevaluate my analysis of equities. Experience has shown that a market event like the commodities crash is often a harbinger of further selling, particularly when its significance is universally dismissed as has been the case in this instance. It seems to me that complacency reigns supreme at just the wrong time and that most market participants are about to be caught on the wrong side of the markets.
My long term view remains bullish on both stocks and commodities, but there is a clear chart setup for a major correction at this time. The chart setup is supported by negative divergences spanning the February to May time frame between SPX and many breadth and momentum indicators.
The fact that this condition is almost universally ignored by traders and investors is coupled with very high bullish readings on a number of sentiment indicators and very low cash positions among funds and individual investors creating an excessively bullish intermediate term sentiment environment.
Earnings season is largely behind us, so the late buying power that enters the market on news has been largely disbursed. The Fed is winding down QE2, so that font of liquidity is drying up. Another round of European Sovereign Debt crisis appears to be gearing up. Next week the US government debt ceiling issue is also on the front burner.
Markets tend to correct this kind of scenario sharply and suddenly and there is good reason to believe that process is under way now.
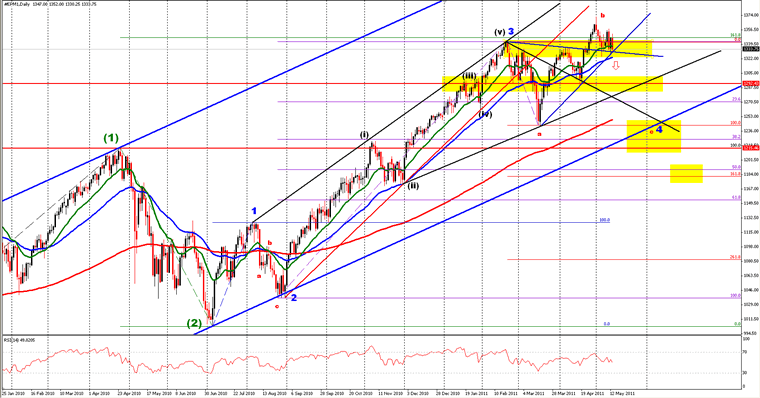
Here's my current view of SPX on the futures chart:
There are quite a few alternate scenarios, and I've presented them all to BullBear Traders members. But at the moment, this is my preferred scenario.
■What is being corrected? The Wave 3 of (3) move from the September 2010 bottom.
■What kind of correction is it? An ABC flat correction for Wave 4 of (3)
■Where are we in the correction? Apparently starting iii of C of 4 of (3)
■What is the target for the correction? Strong support should be found in the zone of the lower rail (blue) of the entire move from March 2009, the 200 EMA, the April 2010 high, the November 2010 high, the March 2011 low, and the 38.2% Fibonacci retracement of 3 of (3).
■Is the correction shortable or should a trader stay in cash? That depends on your style of trading. The magnitude and timing of the likely correction should make it shortable for the intermediate term swing trader.
■Could this be wrong and could the uptrend continue? Of course! A wide variety of factors would seem to indicate that a significant correction is imminent. There's no guarantee at all that support will not hold. Although the risk/reward picture favors the downside for the first time since August 2010, this is still a countertrend trade, which is always a dangerous proposition. There is significant risk that we will be caught out of position when and if the bull market resumes its upward trajectory. Cash is largely a countertrend trade (and short certainly is) in this environment. But this should be as good a setup as we can hope for to either take profit and re-enter at a lower level or even make a little money on the short side. The correction actually began in February with a three wave move down for wave A. The move off the March low was also a three wave move for wave B. That wave ended with the "Bin Laden Is Dead" spike (a classic wave ending news event) and wave C began. We'll get confirmation that C down has begun with a move below the recent low. That could come as soon as Monday, but most likely by Wednesday.
We can see confirmation of the ABC corrective pattern by observing other markets and ratio charts which are showing similar ABC setups in even clearer terms since February:
■Dow Jones World Index
■New York World Leaders Index
■Euro Stoxx 50 Index
■SPX : Total Treasury Market Index
■SPX : US 30 Year Treasury (Daily)
■SPX : VIX (Volatility Index)
■Corporate Junk : 30 Year Treasury
■Grains Index
Technical charts also show bearish divergences with underlying price that go back to January or February, confirming that the markets have been correcting in a sideways ABC pattern for the last few months. Here are just a few examples; there are many more:
■Nasdaq 100 : Dow Industrials
■Russell 2000 : Dow Industrials
■Wilshire 5000 : Dow Industrials
■Apple : QQQ
■SPX : Total Put Call Ratio (50, 200 EMAs)
■Advance-Decline Volume, 50 Day EMA
■Bullish Percent Index
■Stocks Above 50 Day Moving Average
These indicators are now showing signs of being ready to roll over into bearish territory as the market corrects. Eventually they should reset into a buy position (if the bull market is to continue) and we will look for bullish divergences to help us identify the bottom of the correction.
The correction should be fast and scary and should bring out the bears in droves. No doubt figures like Bob Prechter will be making the mainstream financial media rounds next week. The function of the correction, in the context of a larger bull market, will be to force cash positions higher and reset sentiment to bearish levels again, setting the stage for a renewed bull move.
We're seeing some interesting divergences between market professionals and the general investing population. The data is showing that professionals are excessively bullish and heavily invested in stocks and are holding very low cash levels, while non-professionals are uninterested in stocks and invested heavily in bonds.
The following charts are from Sentimentrader.com. First, let's look at market liquidity as measured by cash levels:
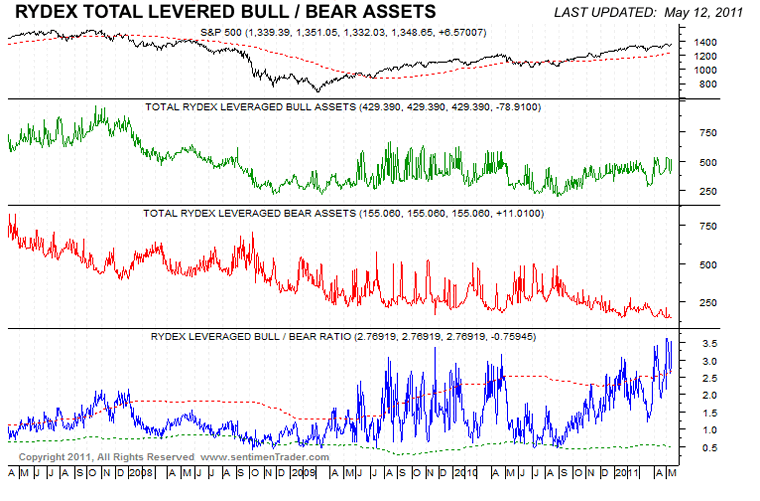
Rydex funds are used by market professionals. Rydex fund cash positions moved sharply lower recently even as the market hovered near its highs:
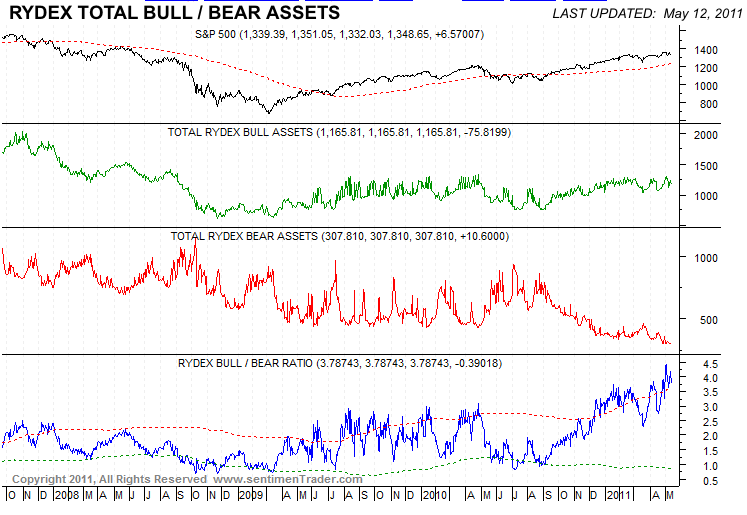
Rydex Bull/Bear asset allocation is stretched far to the upside:
The use of leverage is running very high as well:
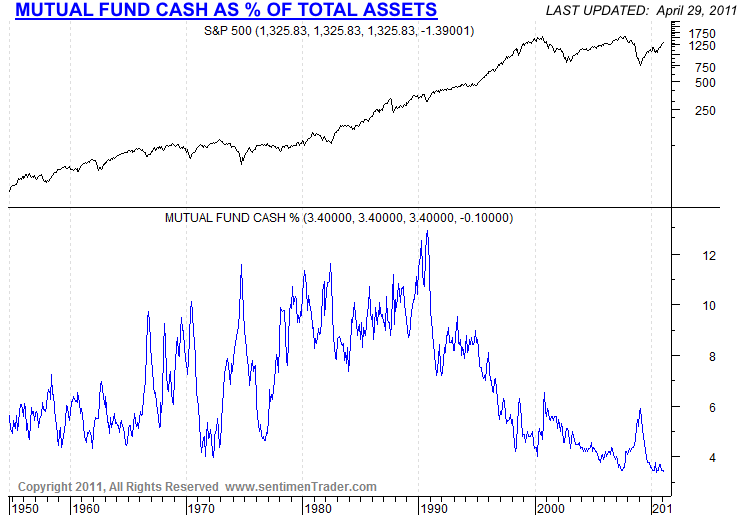
Mutual Funds are apparently totally committed:
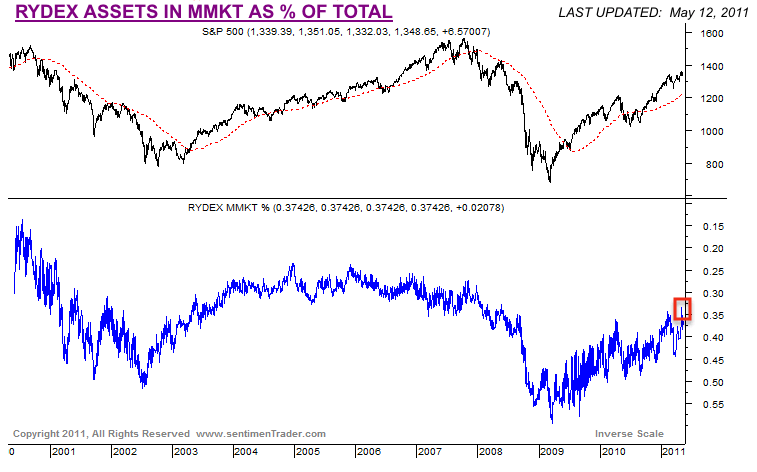
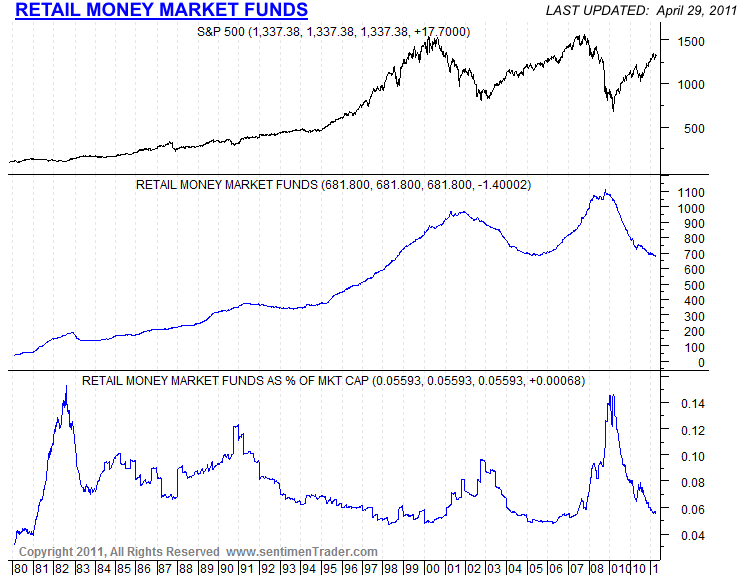
Money Market fund levels are at levels previously associated with tops:
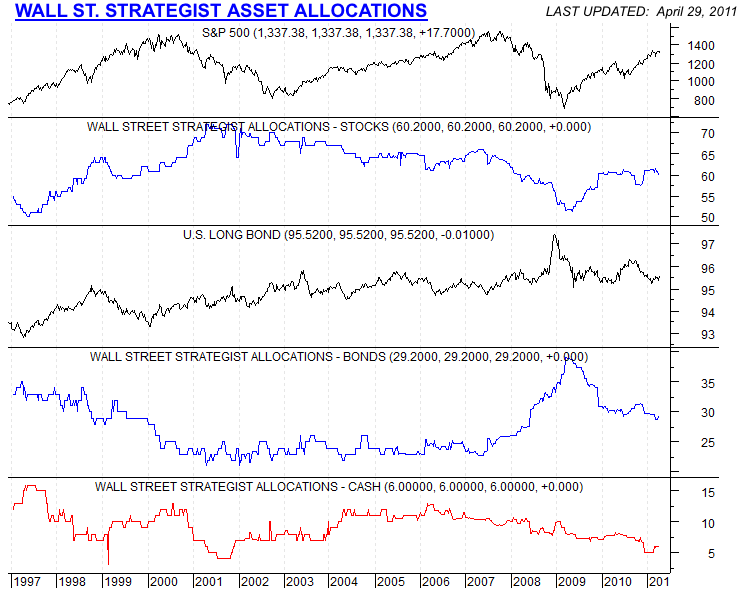
This survey indicates that professionals are heavily allocated to stocks and are holding very low cash levels:
The use of margin is quite high on the NYSE:

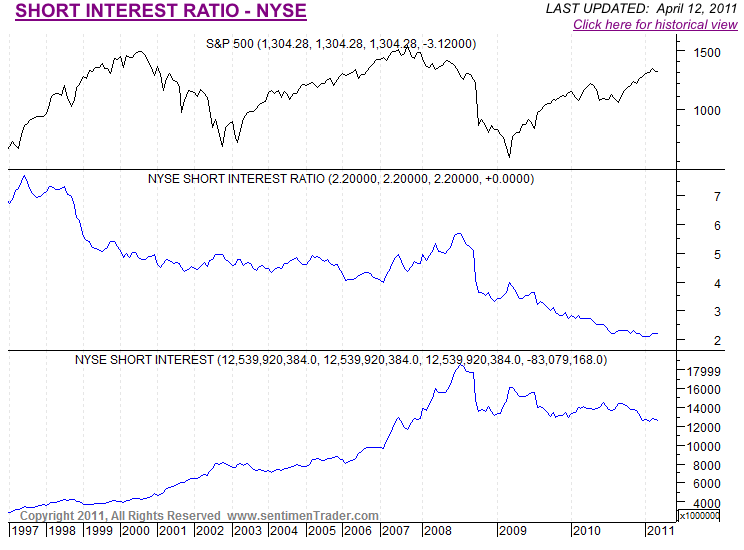
Short interest ratio is very low, so latent buying power from short covering is weak:
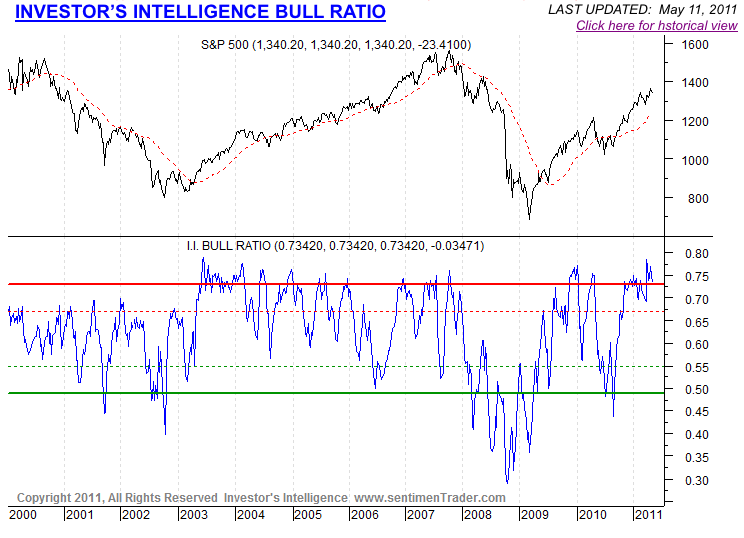
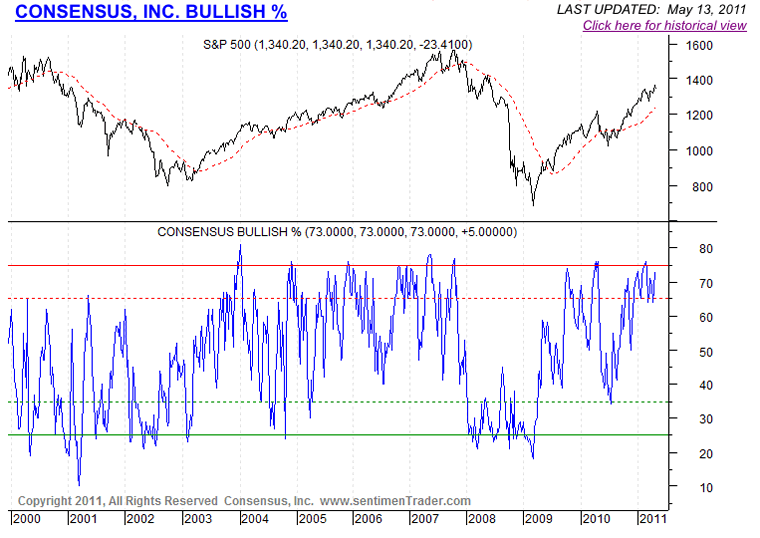
The following four charts show that sentiment surveys of market professionals indicate a very high level of bullishness:

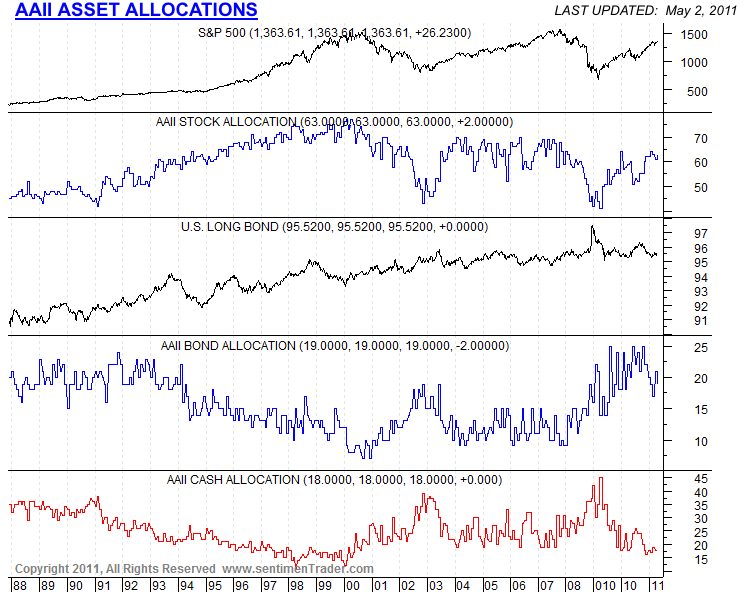
The AAII survey of the general investor population shows a low level of interest in stocks, however.
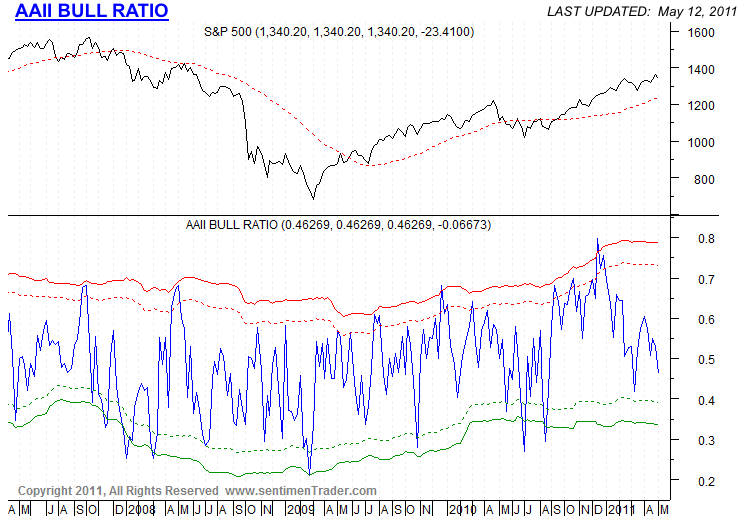
While investors are allocated to stocks, the levels are much lower than the professional segment and bond allocation is much higher, while cash levels are also very low.
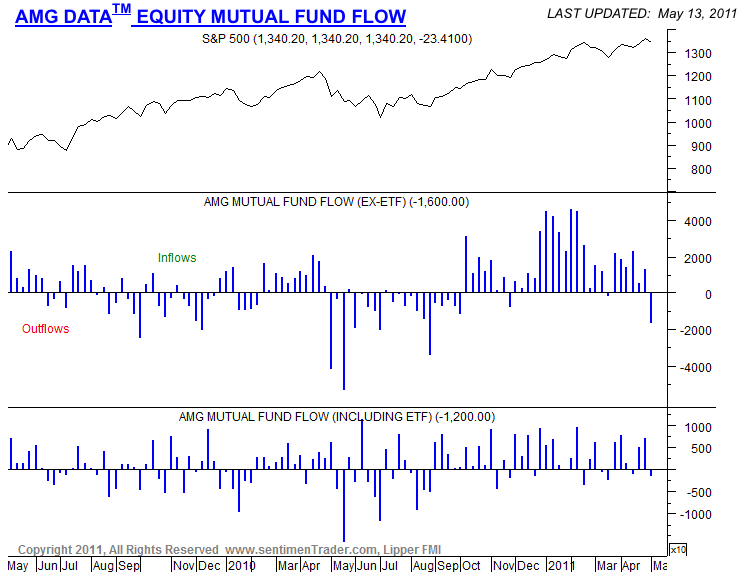
Mutual Funds just saw the first big outflow in quite a while. I wouldn't view that as a contrarian indication at this time.
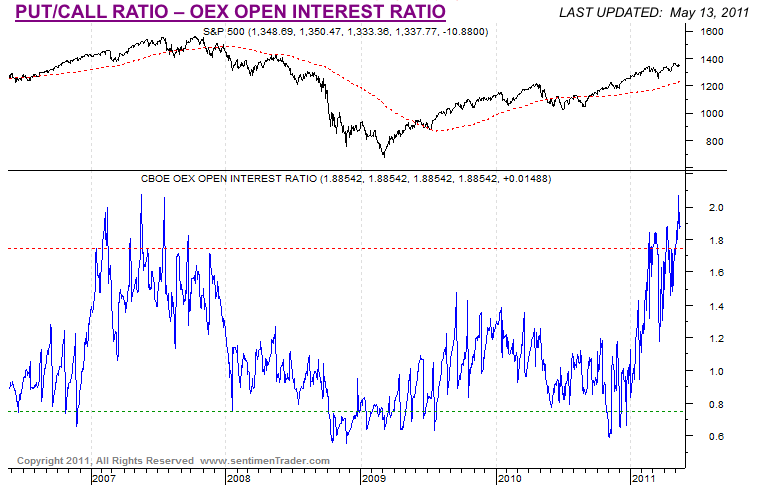
While professionals are heavily committed to stocks, they are also active in puts to a degree not seen since the 2007 top. They may be literally hedging their bets against a big decline.
Overall the picture I am seeing is a setup for a surprise intermediate term decline that scares professionals out of their apparently overconfident complacency and forces cash levels up to a more sustainable level. If the general investor base joins in the next rally off the bottom with the professionals, that may mark the end of the long lateral bear market and the onset of a new long term bull phase.
If support does hold here the next leg up will likely be a 5th wave in a diagonal pattern that will set up a correction. Here's one potential bullish interpretation of the short term picture on a 4 hour chart.
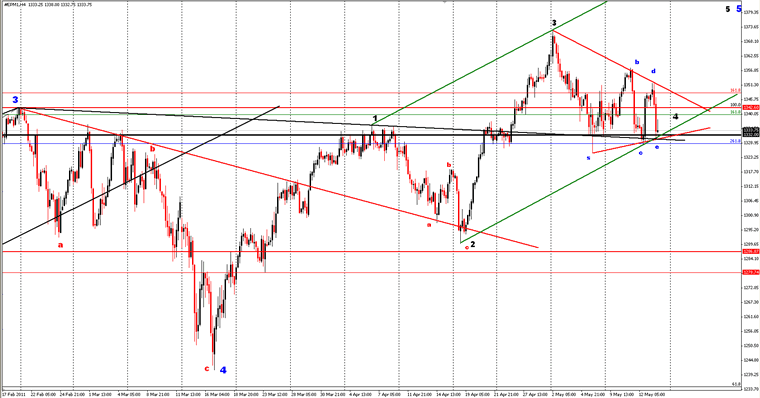
The most bullish view places the market at the cusp of launching into (iii) of 3 of 5 after a sideways triangle abcde correction:

Both of the above scenarios are viable and represent risks to the current short position. A break above the upper boundary of the proposed triangle correction would have to trigger a stop loss on the position. We can also see that the market is perched precariously upon key support and the potential for a gap down below support on Monday morning is high. That could trigger a series of stop loss levels and initiate a cascading decline. Given that just about no one is looking for that kind of scenario, it becomes much more likely. And given the very heavy bullish sentiment and commitment of professionals to the market, there may be no one left to stop the decline once it has begun.
There is long term bearish potential in the current setup as well, but it would be jumping the gun to even speculate about a long term bear turn without first seeing a good size correction and a break of some key support levels. Then we would have to revisit the indicators and see what they are telling us.
To read the full BullBear Market Report, please join us at BullBear Traders room at TheBullBear.com.

Disclosure: No current positions.
By Steve Vincent
Steven Vincent has been studying and trading the markets since 1998 and is a member of the Market Technicians Association. He is proprietor of BullBear Trading which provides market analysis, timing and guidance to subscribers. He focuses intermediate to long term swing trading. When he is not charting and analyzing the markets he teaches yoga and meditation in Los Angeles.
© 2011 Copyright Steven Vincent - All Rights Reserved Disclaimer: The above is a matter of opinion provided for general information purposes only and is not intended as investment advice. Information and analysis above are derived from sources and utilising methods believed to be reliable, but we cannot accept responsibility for any losses you may incur as a result of this analysis. Individuals should consult with their personal financial advisors.
© 2005-2022 http://www.MarketOracle.co.uk - The Market Oracle is a FREE Daily Financial Markets Analysis & Forecasting online publication.