Silver Bull Market Blow Off Forecast for 2008
Commodities / Gold & Silver Nov 19, 2007 - 11:34 AM GMTBy: Roland_Watson
 Bulls climb a wall of worry and bears slide down the slope of hope. So go two well-known investment proverbs. The first one could apply to gold and silver investors.
As silver and gold break out into new highs, we begin to hear the calls for an end of the precious metals bull market. This may come in articles, which state that the US Dollar plunge is now over or perhaps high prices have finally unleashed new supply onto the markets. I even read one article that stated that though gold had advanced over one hundred dollars above its last major high of $730 back in May 2006, it was STILL in a correction phase. Come on guys, a bit of common sense would not go amiss here, in my book gold breaking $100 above old highs is not a correction, it's a bull market!
Of course, I can't say with an oath where exactly silver and gold are going, but I believe it is higher yet and I just want to present two items which help bolster that opinion. You may have your own favorite reasons but first I start with a simple Elliott Wave pattern. Bull markets trace out a 5-part wave that reflects investor sentiment and eventually mania. The three phases are the smart money recognizing a bear market bottom and getting in at the ground floor to create the first wave of buying. The second wave of buying occurs when specialist investment funds pick up the smell of a bull market and add further buying and momentum to the market. The final wave is often a “blow-off” phase when the bull market is all over the front pages and the mainstream investor is looking for a piece of the action. The phrase “blow-off” denotes a final pent up release of investor energy that drives the prices to wild and overvalued numbers.

We have seen the pattern many a time in other markets both on a small scale and a grand scale across a diversity of asset classes. Elliott Wave numerates these phases of investor psychology as waves 1, 3 and 5. In between these we have the correction waves 2 and 4, which punctuate and recalibrate overt enthusiasm. I read a lot about Elliott Waves where a whole load of patterns are allowed and this just brings in greater scope for erroneous interpretations. So I want to keep it simple and say that this is how I see the silver market. We have done with wave 4 and we are now onto wave 5. As I said, wave 5 is a high probability blow off event.
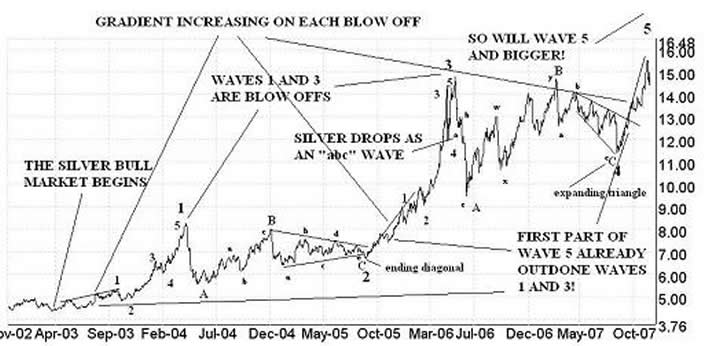
There is no real problem with this wave pattern; the bull began back in 2003 with wave 1 which had a mini blow off in 2004. Wave 2 corrected and then wave 3 surged on to a bigger blow off in 2006. Wave 4 corrected the exuberance and now we are off to the races again with a final wave 5 and going by the previous two waves, yet another bigger blow off.
The other interpretation to all this would have been that waves 1 to 3 were actually just a bigger correction called an ABC wave. This is the favoured pattern of hyper-deflationists who foresaw a brutal and fast crash for any hard asset as a deflationary depression set in. The fact that we have new highs has put that more pessimistic ABC interpretation to bed.
A further clue to me in this pattern that this is not a “crash and burn” scenario is the way silver corrected after it hit its May 2006 high near $15. It dropped but only as an “abc” wave (see chart) suggesting this was no major market top but another was yet to come. I say that because most major bulls end with a downward and more aggressive “12345” impulse wave.
Finally, just look at how silver has taken off since the lows of August 16 th 2007. Compare that to the gradients on the first waves (wave 1) of the 2004 and 2006 blow offs (see chart). What can I say except the charts are pointing to an extraordinary event in silver, something that only the classic blow off of 1980 may outdo. I won't say anymore, the chart is getting too cluttered with bullish signs.
The silver spike of 2008 will be a notable event and many will lose money on it as they get on too late or get off too late. That's the raw fact of free market capitalism; it takes from the poor silver strategists and gives to the good (or fortuitous) silver strategists. Make sure you are in the latter camp; don't rely on feelings when it comes to taking your profits. Get the objective tools you need to get the job done.
By Roland Watson
http://silveranalyst.blogspot.com
Further analysis of the SLI indicator and more can be obtained by going to our silver blog at http://silveranalyst.blogspot.com where readers can obtain the first issue of The Silver Analyst free and learn about subscription details. Comments and questions are also invited via email to silveranalysis@yahoo.co.uk .
Roland Watson Archive |
© 2005-2022 http://www.MarketOracle.co.uk - The Market Oracle is a FREE Daily Financial Markets Analysis & Forecasting online publication.


