Asian Tiger Sinks Teeth Into Gold
Commodities / Gold and Silver 2011 May 23, 2011 - 12:51 PM GMTBy: Frank_Holmes
 The World Gold Council (WGC) released its quarterly “Gold Demand Trends” report last week and, as always, it was filled with fascinating data on the strength of the global gold market. Gold demand grew 11 percent to 981.3 tons during the first quarter of 2011, worth $43.7 billion at quarter-end’s price levels.
The increase was driven by a significant rise in demand for gold as an investment, up 26 percent from a year ago, as emerging markets look to protect their assets from rising inflation. Demand for gold bars and coins was up 62 percent and 42 percent, respectively.
A slight pullback in prices during the middle of the quarter and “persistent high inflation levels” pushed China into the position as the world’s largest market for gold investment. Chinese citizens devoured nearly 91 tons of gold bars and coins, more than double the amount of a year ago.
This isn’t exactly a new phenomenon in China. From 2007 to 2010, investment demand grew at a compounded annual growth rate of 68 percent, according to the CPM Group. The firm forecasted Chinese investment demand to increase 34.7 percent during 2011 but based on this new data, it may need to adjust its forecast.
Song Qing, director of Shanghai-based Lion Fund Management, told Bloomberg news that, “Gold has taken on a new role in China amid concern about inflation…Just imagine the total wealth in China and even a small percentage of that choosing to buy gold. This demand is going to be enormous.”
The “Love Trade” was also in full swing during the first quarter. Led by India and China, jewelry demand rose 7 percent on a year-over-year basis. Combined, the countries accounted for roughly 67 percent of world total jewelry demand.
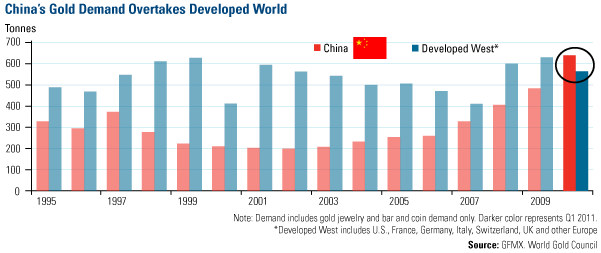
For the first time, the demand for gold in China was so strong during the first quarter it outpaced the combined total of the developed West. If you lump together the gold demand of the U.S., France, Germany, Italy, Switzerland, the U.K. and other European countries, the sum of these countries is still outpaced by China. That’s despite triple-digit increases in demand from France, Germany and Switzerland.

The CPM Group says the origins of this milestone in China’s gold market can be traced back to the late 1980s when the government began lifting restrictions on gold ownership. This led to the establishment of the Shanghai Gold Exchange and other ways Chinese citizens could put a portion of their wealth in gold.
Then in 2001, the government lifted its final controls on the gold market, igniting one of the greatest booms in gold demand history. From 2001 to 2010, China’s annual consumption of gold grew at a 7.5 percent compounded annual growth rate.
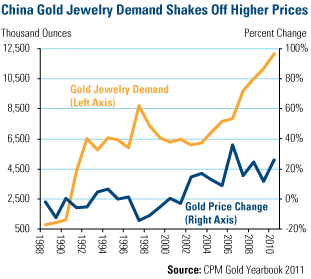
This chart shows how China’s demand for gold jewelry has increased from just over 500,000 ounces in the late 1980s to over 12 million ounces at the end of 2010, in spite of gold going from $200 to $1,000 and now $1,500 an ounce.

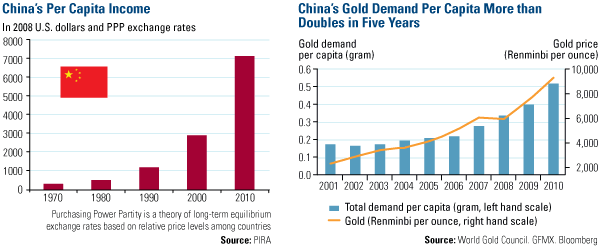
The rise in gold prices and consumption has coincided with a dramatic rise in China’s per capita incomes. The chart on the left shows that per capita incomes in China have risen from around the $3,000 level in 2000 to roughly $7,000 in 2010. This means that the average Chinese citizen has over twice the income he or she did in 2000. Today, China is second only to the U.S. with a middle class population of 157 million people, according to the Organization for Economic Co-operation and Development (OECD).

The chart on the right shows, at least in part, what many have chosen to do with that additional money—buy or invest in gold. On a per capita basis, per capita consumption of gold in China has more than doubled since 2005.
Despite this strong rise in per capita consumption, an analyst from Standard Chartered Bank said that there is still much room to grow, “In terms of gold consumption per capita, there is no doubt that [China and India] have a lot of catch-up potential and the impact on gold prices could be dramatic.”
One way China’s per capita consumption can catch up is if investors continue to seek safety from inflation in the yellow metal. Demand for gold as an investment has grown at a 14 percent annual clip since the Chinese government deregulated the local gold market in 2001.

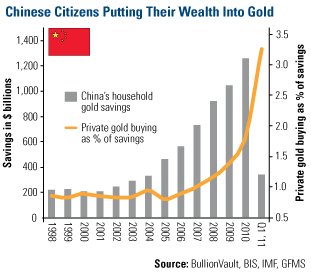
This chart, courtesy of my friend Adrian Day, shows Chinese citizens’ gold investment as a savings. Similar to the other charts I presented, it shows how much China’s gold market has changed over the past 10 years.
The total amount of household savings invested in gold has grown from about $200 billion in the late 1990s to $1.2 trillion in 2010. In fact, the total savings invested just during the first quarter of 2011 is equal to the total amount invested in 2004, and more than the previous six years.
Recently, the government and state banks have encouraged citizens to purchase gold and initiated gold purchasing programs. In February, the Industrial and Commercial Bank of China (ICBC) and the WGC launched the “Only Gold Gift Bar” program which offers gold bars weighing 10, 20, 50, 100 and 1000 grams. In less than three months, this program has already generated orders totaling 1.8 tons, according to the WGC.
The first quarter of 2011’s demand trends leads me back to the two drivers I’ve highlighted before and are captured in the new report - Two Key Drivers of Gold Demand: Fear Trade and Love Trade. In the U.S., the Fear Trade, a factor of negative real interest rates and increased deficit spending, is driving demand for gold. In China, India and other emerging markets, the Love Trade, a combination of rising incomes and a cultural affinity for gold, is driving demand for gold.
Together the two are powering gold demand to new levels. Download your copy of the special report now.
For more updates on global investing from Frank and the rest of the U.S. Global Investors team, follow us on Twitter at www.twitter.com/USFunds or like us on Facebook at www.facebook.com/USFunds. You can also watch exclusive videos on what our research overseas has turned up on our YouTube channel at www.youtube.com/USFunds.
Please consider carefully the fund's investment objectives, risks, charges and expenses. For this and other important information, obtain a fund prospectus by visiting www.usfunds.com or by calling 1-800-US-FUNDS (1-800-873-8637). Read it carefully before investing. Distributed by U.S. Global Brokerage, Inc.
Standard deviation is a measure of the dispersion of a set of data from its mean. The more spread apart the data, the higher the deviation. Standard deviation is also known as historical volatility. All opinions expressed and data provided are subject to change without notice. Some of these opinions may not be appropriate to every investor. The S&P 500 Stock Index is a widely recognized capitalization-weighted index of 500 common stock prices in U.S. companies. The NYSE Arca Gold BUGS (Basket of Unhedged Gold Stocks) Index (HUI) is a modified equal dollar weighted index of companies involved in gold mining. The HUI Index was designed to provide significant exposure to near term movements in gold prices by including companies that do not hedge their gold production beyond 1.5 years. The MSCI Emerging Markets Index is a free float-adjusted market capitalization index that is designed to measure equity market performance in the global emerging markets. The U.S. Trade Weighted Dollar Index provides a general indication of the international value of the U.S. dollar.
Frank Holmes Archive |
© 2005-2022 http://www.MarketOracle.co.uk - The Market Oracle is a FREE Daily Financial Markets Analysis & Forecasting online publication.


