


The Stock Market Coming 6-year Cycle Peak
Stock-Markets / Cycles Analysis May 28, 2011 - 11:20 AM GMTBy: Clif_Droke

 The year 2011 to date has seen its share of ups and downs in the financial market, yet nothing like the volatility of 2010 has made its appearance. With an important long-term yearly cycle scheduled to peak in just a few months, this would be a good time to look ahead as we try to discern what the balance of the year will bring.
The longest yearly cycle in the Kress series of cycles is 120 years. By itself, it’s not a cycle but rather the composite of the six component cycles, all of which are scheduled to bottom simultaneously in late 2014 to form the bottom of the composite 120-year period. Mr. Kress refers to the 120-year as the Grand Super Cycle and also the Mega Cycle.
In the latest edition of his SineScope advisory (15 Phoenix Ave., Morristown, NJ 07960), Kress writes, “Of the six component cycles, the interaction between any two of the three most significant cycles – the 30-year mini super cycle; the 12-year primary direction cycle; the 6-year secondary direction cycle – portrays the long term position of the market. Similar to a year which has four quarters/seasons – spring, summer, fall winter – the 120-year includes four 30-year cycles, each effectively representing four economic seasons. The fourth and final 30-year began in late 1984. Midway through the 30-year, 15 years, began the severity of economic winter. This occurred in late September/early October, 1999 (+ or – 1-2 quarters).” Kress pointed out that the S&P 500 index achieved its historic high around 1,535 during that time, which Kress refers to as the “terminal high” for the Grand Super Cycle bull market.
Kress goes on to explain the importance of the 12-year primary directional cycle and its relationship to the 30-year cycle. He writes, “When adding 12 years at the time of the peak of the previous three 30-year cycles, the market’s level in the twelfth year was higher than at the price of the peak of the 30-year cycle.” He points out that by adding 12 years to the September/October 1999 peak of the previous 30-year cycle brings us to this year’s September/October time frame. He also observes that the market’s early May high of 1,365 in the S&P is over 10% below the 30-year cycle peak back in late 1999/early 2000.
What Kress is suggesting here is that if you look at the prior 30-year cycle peaks from 1909 through 1999 and then add 12 years to those peaks, each peak was higher than the previous one, beginning in 1921 and continuing until 1981. The most recent 30-year cycle peak in late 1999, however, was the only time in the last 120 years that there was a *lower* peak. He illustrates this phenomenon in the following graph.
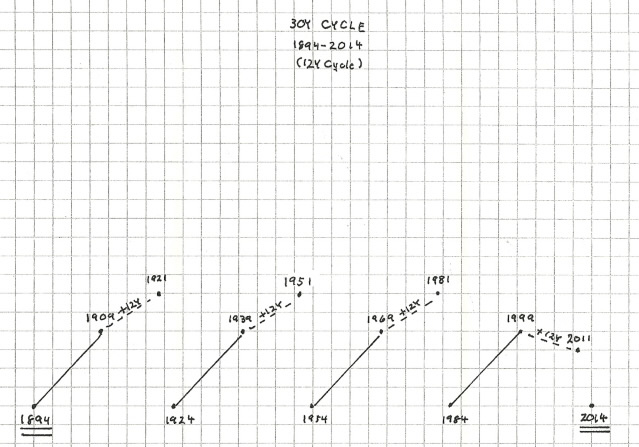
In view of the above chart, Kress offers this opinion: “Clearly, the market is telling us that the underlying economics since the turn of the century are waning.”
Although the long-term economic trend is contracting, we’re currently passing through a small window within the yearly Kress cycles which began at the end of 2008 when the 6-year cycle bottomed. The bottom of this important cycle lifted a sufficient amount of downward pressure from the financial market to allow for a temporary reprieve in the de-leveraging process which began in 2007 with the credit crisis. The nominal force behind the credit crisis was the metastasis of toxic debt but the impetus behind it was the long-term yearly cycles which compose the Grand Super Cycle of 120 years and is scheduled to bottom in late 2014. The final “hard down” phase of the 60-year component cycle, for instance, began in 2007-08.
With the bottom of the 6-year cycle in late 2008 and the corresponding “good years” of 2009-2011, individuals and institutions have had an excellent opportunity to get their balance sheets in order and expunge debt from their lives as much as possible. The 6-year cycle is scheduled to peak in October this year but as Mr. Kress has emphasized, it’s a possibility that the weight of the long-term 30-year, 40-year and 60-year cycles could end up foreshortening the peaking process before October. It’s important therefore to be prepared for the eventual end of the Fed’s loose money policy and the closing of the 6-year cycle window, the effects of which should be felt within a few months.
To be sure, the months ahead are not without challenges. And while the market could well be in the midst of an extended longer-term topping process, 2011 won’t likely witness a return of a vicious bear market. As Ken Fisher recently has pointed out in a recent Forbes column, “…when two up years have followed a big bear-market bottom we’ve never had a disaster third year – ever. So don’t bet on it.” He went on to observe, “Third years of U.S. bull markets historically have been up a little or down a little, averaging 3.7%, rarely up by double digits…” His conclusion harmonizes with my forecast for 2011 which we talked about in January, namely that the S&P will likely see either a low single-digit gain or a low single-digit loss by year’s end (i.e. a trading range), but not a bear market.
While the third year of a recovery doesn’t normally witness a crash, it can be a topside transition year for stocks and commodities. With the upside momentum generated by the Fed Quantitative Easing 2 (QE2) program, a topping process encompassing several months would seem to be the most likely outcome. This would also jibe with the Kress Cycle outlook.
It would be unusual indeed for a recovery as strong as the one we’ve experienced since March 2009 to end without a substantial pickup in interest for new shares. The greed for initial public stock offerings has characterized most previous bull markets and a sizable take-off in the IPO market would fit the bill for a topping market. The market for IPOs has just starting to take off after being dormant the last few years – witness the recent euphoria for the recent LinkedIn stock offering. A red-hot market for IPO shares is typical of a topside transition year.
Since the peak of the 30-year mini Super Cycle in late 1999 you may have noticed that bear markets, recessions and the subsequent recoveries that follow have been much quicker and more pronounced than at any time in the past 100 years. Along these lines, in a recent interview, James Grant of Grant’s Interest Rate Observer, made a thought provoking statement. He said, “My big thought is that our crises are becoming ever closer in time. The recovery time from the Great Depression was 25 years. The stock market peaked in 1929. It got back there in 1954. We had a peak in 2000, crash, levitation, then the biggest debt crisis in anybody's memory. The cycles are becoming compressed. The temptation to become invested at peaks of these shorter cycles is ever greater.”
The reason for this can be ascribed to the conflicting force of central bank monetary intervention and the long-term downward force of the long-term Kress cycles. This tug-of-war has been fierce, and while it may appear that the Fed is winning, the natural downward force of the cycles should ultimately prevail by the time of the 120-year cycle bottom arrives in 2014. Deflation, not inflation, will be the watchword once the 6-year cycle has peaked and the residual effects of the Fed’s loose money policy has abated.
While we’re on the subject of the Kress cycles, there are some intriguing observations that can be made regarding natural phenomenon. In light of recent weather events I couldn’t help asking myself, “Does the influence of the long-term Kress cycles extend beyond the stock market?” I’ve often wondered if is there is indeed a correlation between the peaking and bottoming phases of the long-term cycles and weather-related events and natural disasters. A brief survey of recent history is certainly enough to give one pause for thought.
Consider that the 6-year cycle is currently in its peaking stage and that the last time this cycle peaked was in 2005, with previous peaks in 1999 and 1993. The year 2005, the year of the previous 6-year cycle peak, was characterized by the most severe hurricane season the U.S. had seen in decades. Hurricane Katrina made its devastating presence known about a month before the 6-year cycle peaked in ’05. It resulted in the flooding of New Orleans and several cities along the Gulf Coast.
The 6-year cycle peak of 1993 was marked by the “Great Flood of 1993” in which the Mississippi and Missouri Rivers flooded from April to October (at which time the cycle actually peaked). The flood was among the most costly and devastating to ever occur in the United States, with $15 billion in damages and by some measures was the worst U.S. flood since the Great Mississippi Flood of 1927 (which incidentally was also a 6-year cycle peak year).
This year as the current 6-year cycle peaks into October we’re witnessing yet another major flood. The current Mississippi River flood which began last month is already being called the worst flood in 80 years and is still ongoing. Assuming the correlation between the 6-year cycle peak and weather-related disasters isn’t merely coincidental, the worst may still be to come in terms of weather disasters (between now and September/October) based on historical analogs.
Gold ETF
Although the dollar has been strong recently and commodities (most notably oil) have been generally weak, gold has shown relative strength lately in spite of the strong dollar. Our proxy for the gold price – the SPDR Gold Trust ETF (GLD) – closed decisively above its 15-day moving average on Friday, May 20. This marked the first time since the top of the previous rally was seen last month that GLD has been decisively above this immediate-term trend line.
After holding up well and showing relative strength during the recent commodities correction, GLD recently confirmed an immediate-term bottom and is gearing up for a test of the previous high from late April. Using the previous 6-year cycle analog from 2005, GLD should be able to achieve at least a token new high in June before its next short-term peak.
Cycles
Over the years I’ve been asked by many readers what I consider to be the best books on stock market cycles that I can recommend. While there are many excellent works out there on the subject of technical and fundamental analysis, chart reading, etc., precious few have addressed the subject of market cycles. Of the relatively few books on cycles that are available, most don’t even merit mentioning. I’ve read only one book in the genre that I can recommend – The K Wave by David Knox Barker – but even that one doesn’t deal directly with stock market cycles but instead with the economic long wave. I’m pleased to announce, however, that after nearly 10 years of research and one year of writing, I’ve completed a book on the subject that I believe will meet the critical demands of most cycle students. It’s entitled, The Stock Market Cycles, and is available for sale at:
http://clifdroke.com/books/Stock_Market.html
Order today to receive your autographed copy and a FREE 1-month trial subscription to the Momentum Strategies Report newsletter (published three times each week).
Order today to receive your autographed copy and a FREE 1-month trial subscription to the Gold & Silver Stock Report newsletter. Published twice each week, the newsletter uses the method described in this book for making profitable trades among the actively traded gold mining shares.
By Clif Droke
www.clifdroke.com
Clif Droke is the editor of the daily Gold & Silver Stock Report. Published daily since 2002, the report provides forecasts and analysis of the leading gold, silver, uranium and energy stocks from a short-term technical standpoint. He is also the author of numerous books, including 'How to Read Chart Patterns for Greater Profits.' For more information visit www.clifdroke.com
Clif Droke Archive |
© 2005-2022 http://www.MarketOracle.co.uk - The Market Oracle is a FREE Daily Financial Markets Analysis & Forecasting online publication.