


Stock Market Disconnect, 8.6 Year Cycle Bottoming
Stock-Markets / Stock Markets 2011 Jun 06, 2011 - 03:43 AM GMTBy: Andre_Gratian

 Very Long-term trend - The continuing strength in the indices is causing me to question whether we are in a secular bear market or two consecutive, cyclical bull/bear cycles. In any case, the very-long-term cycles are down and, if they make their lows when expected, there will be another steep and prolonged decline into 2014-16.
Long-term trend - In March 2009, the SPX began a move which evolved into a bull market. Cycles point to a continuation of this trend for several more months.
SPX: Intermediate trend - The SPX has met its 1370 projection and is consolidating. The odds still favor a rise to the next logical target of the low 1400s before the beginning of an intermediate correction. (There is no change from last week's analysis)
Analysis of the short-term trend is done on a daily basis with the help of hourly charts. It is an important adjunct to the analysis of daily and weekly charts which discusses the course of longer market trends.
Market Overview
Every time there is a correction in the stock market after it has had a good run, there is a lot of speculation that it might be the beginning of an important decline. This is the case again today, especially when there are signs that the economy is slowing down. Last Friday, the unemployment rate ticked up to 9.1%, and the number or jobs created fell to 54K, far below the previous month's report of 232K, and far worse than what had been anticipated, and this was only one of several negative economic reports.
Since the SPX filled its phase count of 1370 five weeks ago, the indices have been correcting. But there is no technical evidence that the equity indices are at the end of the bull market which started March 2009, or even that it has started an intermediate correction (yet), for that matter! This is what I intend to demonstrate in this newsletter. We'll look at the weekly, daily and hourly charts of the SPX, as well as sentiment.
Chart Analysis
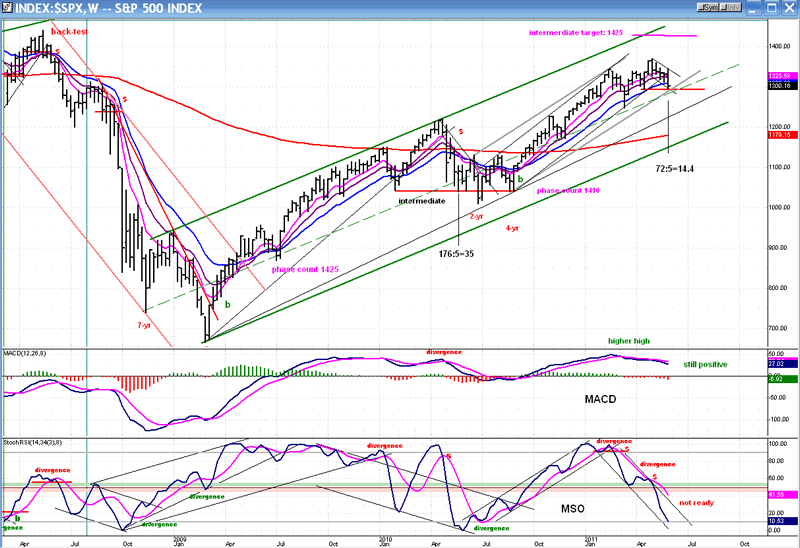
We'll start with the Weekly Chart of the SPX.
Our first observation is that the SPX is not only trading within its long-term channel, but it remains in the upper half of that channel. After two years of rising prices, there is some evidence of deceleration in the trend because the index has failed to make it all the way to the top of the channel before starting to correct. But what kind of correction is it making?
Since the March 2009 low, there has only been one correction of intermediate nature, and that was during April, May and June 2010. In the first five weeks of that correction, SPX gave up 176 points, or declined at the rate of 35 points per week. During the five weeks of the current correction, the index has only dropped 72 points, declining at the rate of a little over 14 points per week. Clearly, so far, we are only in a short-term correction.
Now, let's look at the indicators. When the index rose to a new high, the MACD did also without any sign of negative divergence. By contrast, when the index reached its top price in April, there was negative divergence in the MACD, suggesting that a significant high was being made. There is no such suggestion today! I believe that this will happen only after the index makes a new high and reaches its final intermediate target. The fact that the MACD is still well above the zero line is also a sign that the uptrend is not in any real trouble.
The other indicator (MSO) called the top when strong negative divergence was shown. It has, since then, fallen to the low of its range, but is still declining, and this could mean that the correction has longer to go.
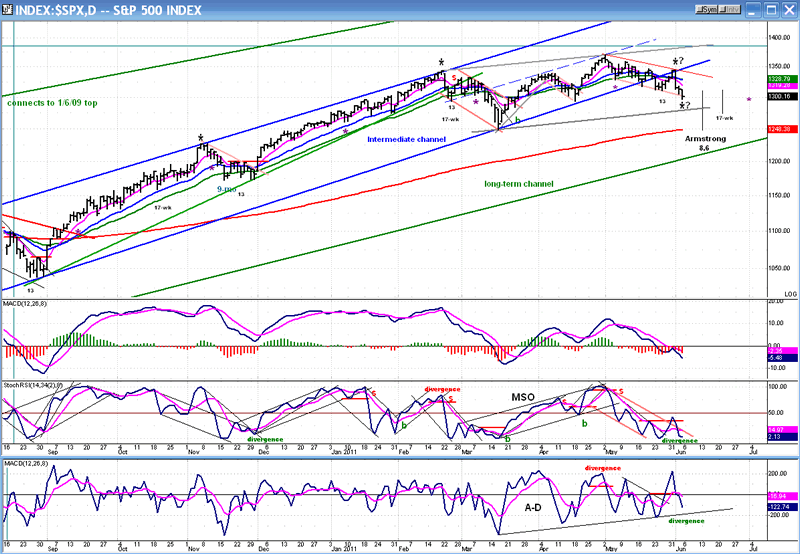
The Daily Chart also shows that the intermediate trend is weakening. The correction has taken it out of its blue channel but, because it has not yet declined below its former short-term low, the index is still in a pattern of rising lows. In fact, it would have to drop below the March low of 1249 to confirm an intermediate correction, and this could happen before we make a new high, but the indicators suggest that we are getting close to a low.
On May 25, the index made a new correction low and the MSO became oversold which, among other things, triggered a rally. However, the rally came without any positive divergence showing in the three indicators. Perhaps for this reason (among others) the rally failed just short of overcoming its former short-term high, and the index promptly made a new low. However, this new price low is now accompanied by some good positive divergence in the A/D indicator, and a slight dose of the same in the MSO. This condition offers the index a much better chance of signaling a near-term reversal, especially since, on Friday, the SPX hit a good P&F downside projection.
The 13-wk cycle ostensibly made its low on 5/25, and the 14-15-wk cycle -- which normally has a 72- trading day phase -- may have completed an inversion on Friday. The rally spurred by the 13-wk cycle failed because it met with resistance when the SPX back-tested its broken trend line, and because the 72-day cycle appears to have inverted, this time.
Friday was exactly 72 trading days from the last asterisk of 2/18, and it coincides with the SPX meeting a P&F downside projection. Putting all that together, there is a pretty good chance that Friday was the low of the near-term decline, and perhaps of the entire correction as well.
Even if this is so, the Armstrong 8.6-yr PI cycle date is still a week away and, since it is supposed to be a low, it could hold the SPX back from making a new high for a little longer.
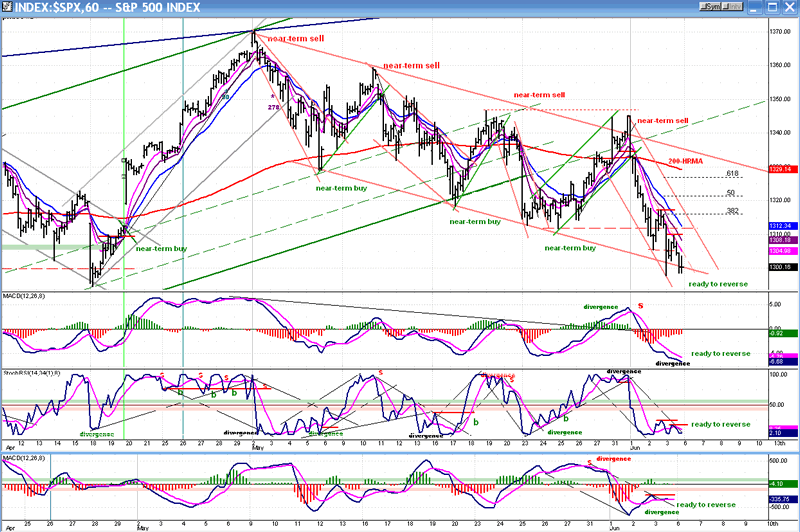
The Hourly Chart clearly shows how close the SPX is to a near-term reversal. The index met a downside P&F projection early in the day on Friday, and is at the bottom of its correction channel. It has bounced, and has come back down to test its low toward the close. The momentum indicators are crawling along the bottom, and the A/D has refused to go lower for the past two trading days and is showing substantial positive divergence.
The SPX has gone through the bottom of the correction channel by about the same amount as it did through the top. This action can signal the low of the move. Also, as I mentioned earlier, Friday was the 72nd day of the 72-TD cycle which may have inverted. With so many positive technical factors, it would not be surprising to see the market open "up" on Monday, and signal a near-term reversal.
Cycles
It looks as if the index is tracking the anticipated cycles, each one of them possibly causing a low point in the market, with the last one -- Martin Armstrong's 8.6 year cycle - making a final near-term low in the middle of the month. We'll have to see what kind of effect this would have on the weekly oscillators if it follows this scenario, and if it is enough to reverse them.
We also have a 17-wk cycle bottoming about a week later, but its effect may be muted.
Breadth
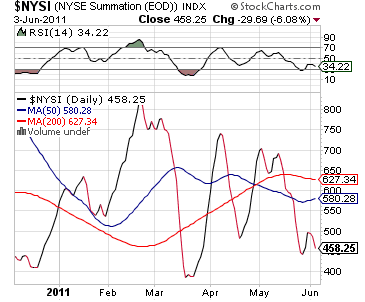
I am only showing the past six months of the NYSE Summation Index (courtesy of StockCharts.com) so that we can see more clearly the pattern that was made by the action of the past few days.
Both the NYSE Summation index and its RSI are showing positive divergence to the SPX price pattern at Friday's low. This positive action by the weekly A/D strongly supports the one that we discussed in the hourly and daily charts. Such bullish coordination in multiple time frames is a strong argument for a reversal to take place imminently.
Sentiment
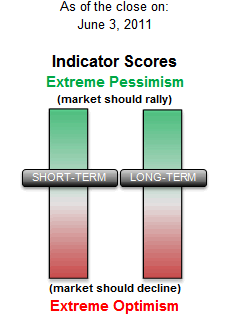
As you might expect, the SentimenTrader (courtesy of same) is also showing a bullish picture, not only in the Long-term, but in the short-term as well.
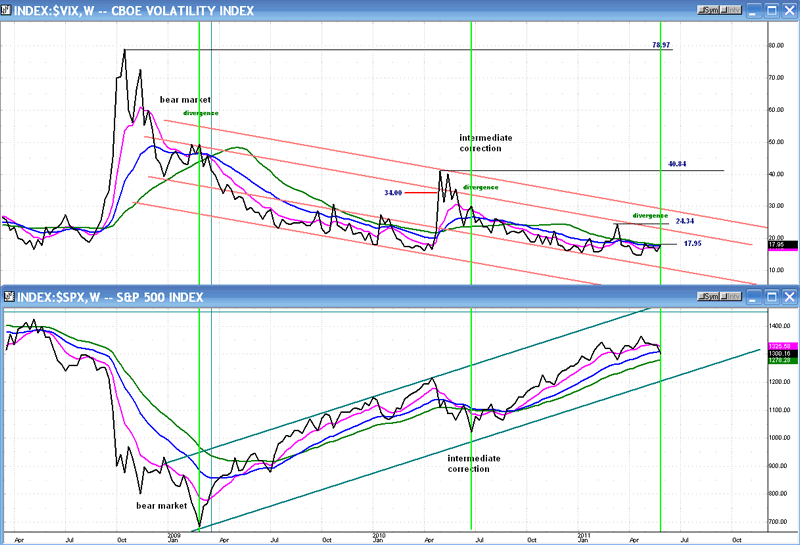
As long as we are looking at potentially bullish scenarios, let's take a look at the VIX in relationship to the SPX. As we know, both move in almost exact, reverse trends; "almost" is good, because it permits us to notice the divergences which precede the reversals, before they occur.
The charts show the weekly closes of the two indices going back three months before the March 2009 low. They give us the opportunity to see how they behave with respect to each other through various market phases, and to see if, based on these relationships, we can draw some firm conclusions about the current market position.
The rise of the VIX is proportional to the degree to which the market declines, achieving much greater heights in a bear market than in an intermediate correction, or a short-term reversal. What is interesting -- and very useful in predicting market lows -- is that the VIX consistently gives us ample advance warning by making a much lower secondary high while the index makes its final low. I have drawn vertical green lines to show this very obvious divergence which precedes a market reversal.
So, based on these observations, can we get a hint of what to expect of the market over the near-term? You bet! First, when the SPX started to correct by rising only to 24.34 before retracing sharply, the VIX appeared to warn us that this would not be a big deal correction. If it had been anticipating an intermediate decline, it would probably have risen closer to the level that it reached in May. And on Friday, as the SPX made a 5-wk low, look at what the VIX did: nothing! It closed the week at 17.95, staying well below its former high.
The VIX is another indicator which is telling us that we should be on our guard for an imminent end to the correction.
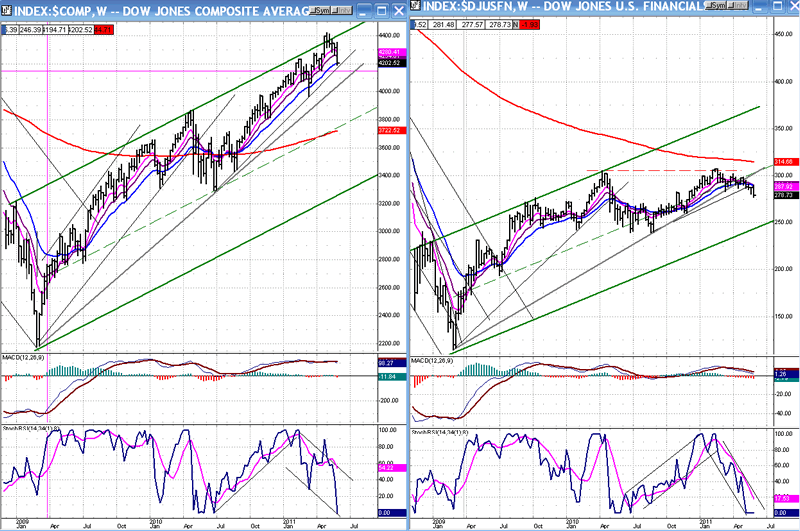
THE DOW JONES COMPLEX
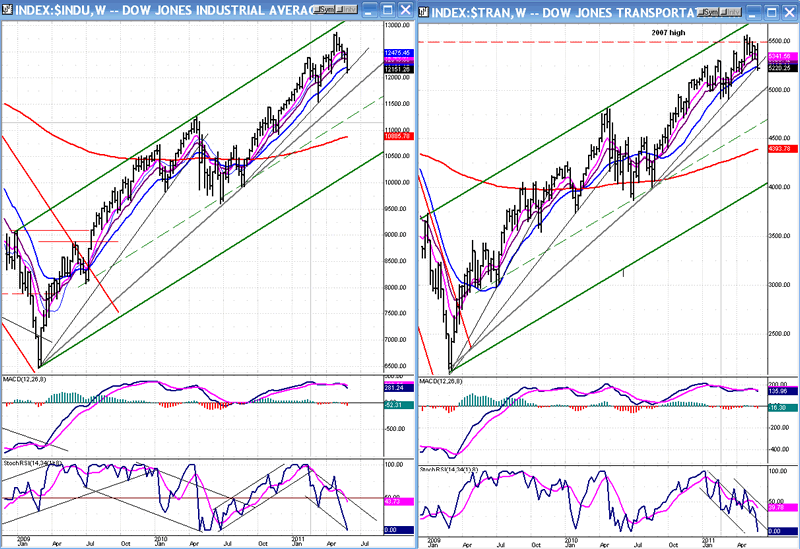
We have not looked at the Dow for a long time. Let's look at its four components. Above, are the industrial and the transportation indices, and below, the composite and financial indexes. All are Weekly Charts.
The first thing which is apparent is that all the indices are still in a long-term uptrend. The next is that the transportation index is the strongest, already having surpassed (briefly) its 2007 high, and the weakest, by far, is the financial index. Unless the latter starts to catch up, the uptrend may run into trouble. Conventional market wisdom has it that the financial sector leads.
Another observation is that, according to the Dow Theory, the bull market is intact.
Finally, all the MACDs are still positive, and the MSOs are oversold, but may require some time to turn around.
All in all, except for the flagrant disparity between the financial index and the others, the intermediate and long term picture is very much the same as that provided by the SPX.
Summary
There is some disconnect between the condition of the hourly chart indicators which seem more than ready to reverse the near-term trend as early as Monday, and the weekly chart which appears to need more time before getting its indicators into a reversal position.
There is also the matter of the Martin Armstrong 8.6-yr cycle which is purported to bottom around the middle of the month and could cause either a new low or, more likely, a pull-back in the near-term uptrend.
This suggests that if we do start a near-term uptrend over the next couple of days - provided that the hourly bullish scenario is not negated by a very weak opening Monday morning - the indices will be subjected to a final pull-back into 6/13-18. If we get this kind of action in the market, it may be enough to bring the weekly indicators into a reversal-ready position.
FREE TRIAL SUBSCRIPTON
If precision in market timing for all time frames is something which is important to you, you should consider a trial subscription to my service. It is free, and you will have four weeks to evaluate its worth.
For a FREE 4-week trial. Send an email to: ajg@cybertrails.com
For further subscription options, payment plans, and for important general information, I encourage you to visit my website at www.marketurningpoints.com. It contains summaries of my background, my investment and trading strategies and my unique method of intra-day communication with Market Turning Points subscribers.
By Andre Gratian
MarketTurningPoints.com
A market advisory service should be evaluated on the basis of its forecasting accuracy and cost. At $25.00 per month, this service is probably the best all-around value. Two areas of analysis that are unmatched anywhere else -- cycles (from 2.5-wk to 18-years and longer) and accurate, coordinated Point & Figure and Fibonacci projections -- are combined with other methodologies to bring you weekly reports and frequent daily updates.
“By the Law of Periodical Repetition, everything which has happened once must happen again, and again, and again -- and not capriciously, but at regular periods, and each thing in its own period, not another’s, and each obeying its own law … The same Nature which delights in periodical repetition in the sky is the Nature which orders the affairs of the earth. Let us not underrate the value of that hint.” -- Mark Twain
You may also want to visit the Market Turning Points website to familiarize yourself with my philosophy and strategy.www.marketurningpoints.com
Disclaimer - The above comments about the financial markets are based purely on what I consider to be sound technical analysis principles uncompromised by fundamental considerations. They represent my own opinion and are not meant to be construed as trading or investment advice, but are offered as an analytical point of view which might be of interest to those who follow stock market cycles and technical analysis.
Andre Gratian Archive |
© 2005-2022 http://www.MarketOracle.co.uk - The Market Oracle is a FREE Daily Financial Markets Analysis & Forecasting online publication.