


Baltic Dry Goods Index Stock Market Non Confirmation
Stock-Markets / Stock Markets 2011 Jun 07, 2011 - 03:55 AM GMTBy: Brian_Bloom

 In a recent article, Richard Russell made the following fascinating observations:
“..Barron's Business Index hit its high in June [1929], which was three months BEFORE the Dow recorded its 1929 record high! After June 1929, Barron's Index headed down. But wait -- the Dow continued higher, recording its record high three months later on September 3, 1929. Following the Dow's September high came the famous 1929 crash, which only two months later took the Dow to a temporary bottom of 198.69 on November 13, 1929.
From there, the post-crash stock market corrected upward, roaring higher, and reaching a peak of 294.07 in April of 1930. So powerful and convincing was the rally from the November 1929 low that many participants were convinced that they were seeing a return of the bull market. The great corrective rally lured many investors back into the market as they sought to recoup some of their 1929 losses.
What I found in my research causes me to catch my breath. All during the huge rebound from the November 1929 low, Barron'sIndex of economic activity was actually declining. The Index registered 99.8 in November with the Dow at its 1929 low. In January 1930 (with the Dow substantially higher) the Index had dropped to 95.2. By April with the Dow at its rally high of 294.07,Barron's Index had declined to 94.2.”
The Baltic Dry Goods Index is, in my mind, a proxy for volume of international trade. On the assumption that demand exceeds supply, the price of sea freight will rise. If supply exceeds demand, the price of sea freight will fall.
Below is a logarithmic (percentage change) chart of the Baltic Dry Goods Index relative to the Standard & Poor Industrial Index in the USA: (source: http://investmenttools.com/futures/bdi_baltic_dry_index.htm )
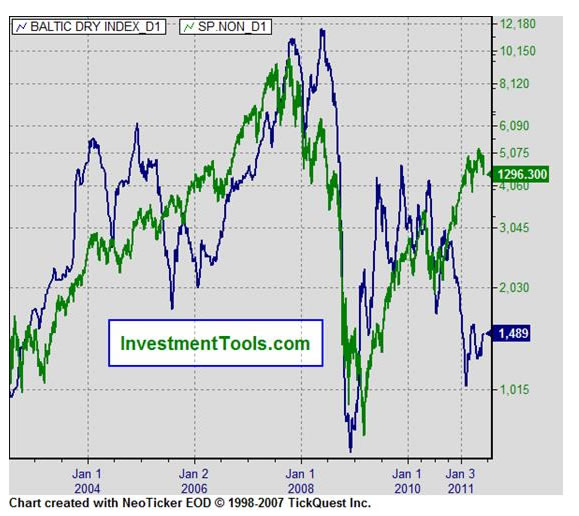
In 2005, the Baltic Dry Goods Index fell from 6,000 to 2,000 and yet the $SPX kept right on climbing.
In 2008, the $SPX acted as a leading indicator – falling a couple of months before the Baltic Dry Goods Index.
But since 2010 we have had another divergence. The Baltic Dry Goods Index fell from 4,000 and then bounced from 1,000 and is current at 1489. The $SPX began to fall AFTER the Baltic Dry Index fell and, like the divergence between the Dow and the Barron’s Index to which Mr Russell has referred, the $SPX and the Baltic Dry have experienced a serious divergence.
To get an idea of the extent of the divergence, the following chart (courtesy DecisionPoint.com) is reproduced below.
Since early 2010 it has risen from 1,000 to 1,300 = 30%; even as the Baltic Dry fell by (4000-1500)/4000 = 62.5%
Now, if we take a closer look at the monthly chart above we see the following:
1. Sell signal on the PMO (Blue line crossed over the green line) in context of a lower top than in early 2010.
2. Break of the price chart below the 17 month MA
3. Break of the price chart below the rising trend line at the apex of a rising wedge
What are the implications of these sell signals? Are they merely trading noise or, in context of the Baltic Dry Goods Index, might they be pointing to something more sinister?
The Point and Figure Chart below (courtesy stockcharts.com) has not yet given a sell signal on the 3% X 3 box reversal scale
However, on the more sensitive 1 point X 3 box reversal scale below, it gave a sell signal on May 5th:

Technically, if the target of 1200 is reached on the more sensitive scale, the less sensitive chart will very likely give a “high pole reversal” warning signal – implying that the market might pull back all the way to the beginning of the pole; which was at 1045.
Unfortunately, at 1,045 on the more sensate scale, the rising blue trend line will have been penetrated on the downside.
Conclusion
If the Baltic Dry Goods Index is indeed a proxy indicator of volumes of dry goods being shipped, then the $SPX may have already topped out.
Author Comment
This conclusion should be seen in context of the chart below – which shows the black SPX line in relation to the various P/E multiples
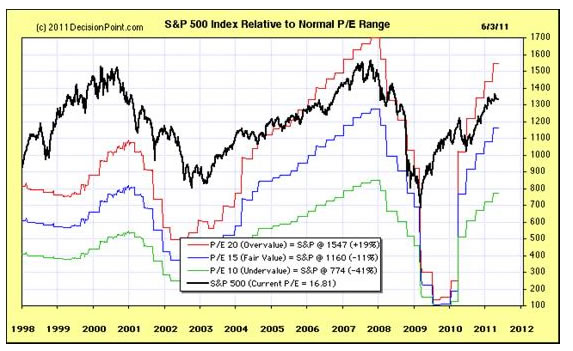
Economic indicators in the past quarter have not been happy. If this impacts on corporate earnings, the black line may well pull back to the blue line – which, in turn, might turn down because of falling earnings.
Overall Conclusion
Technically, a target of 1,000 on the $SPX is not outside the bounds of possibility and, based on the less sensitive Point & Figure chart above, such a development would represent a serious long term sell signal.
I am inclined to take very seriously Mr Russell’s comments regarding the behaviour of Barron’s index in 1929.
By Brian Bloom
Once in a while a book comes along that ‘nails’ the issues of our times. Brian Bloom has demonstrated an uncanny ability to predict world events, sometimes even before they are on the media radar. First he predicted the world financial crisis and its timing, then the increasing controversies regarding the causes of climate change. Next will be a dawning understanding that humanity must embrace radically new thought paradigms with regard to energy, or face extinction.
Via the medium of its lighthearted and entertaining storyline, Beyond Neanderthal highlights the common links between Christianity, Judaism, Islam, Hinduism and Taoism and draws attention to an alternative energy source known to the Ancients. How was this common knowledge lost? Have ego and testosterone befuddled our thought processes? The Muslim population is now approaching 1.6 billion across the planet. The clash of civilizations between Judeo-Christians and Muslims is heightening. Is there a peaceful way to diffuse this situation or will ego and testosterone get in the way of that too? Beyond Neanderthal makes the case for a possible way forward on both the energy and the clash of civilizations fronts.
Copies of Beyond Neanderthal may be ordered via www.beyondneanderthal.com or from Amazon
Copyright © 2011 Brian Bloom - All Rights Reserved
Disclaimer: The above is a matter of opinion provided for general information purposes only and is not intended as investment advice. Information and analysis above are derived from sources and utilising methods believed to be reliable, but we cannot accept responsibility for any losses you may incur as a result of this analysis. Individuals should consult with their personal financial advisors.
Brian Bloom Archive |
© 2005-2022 http://www.MarketOracle.co.uk - The Market Oracle is a FREE Daily Financial Markets Analysis & Forecasting online publication.