


Stock Market Seasonality – Historical Data, Trends & Market Timing
Stock-Markets / Global Stock Markets Nov 22, 2007 - 02:14 AM GMTBy: Joseph_Dancy

 We are entering what has historically been the best season to be invested in the stock market. According to Ned Davis Research if an individual invested $1,000 in the S&P 500 index from November 1 st to April 30 th every year from 1950 to 2006 – the ‘winter season' – and held cash in their account for the remainder of each year the account would be worth an astonishing $38,700 before tax considerations.
If, over the same 56 year period, an investor had invested the $1,000 in the S&P 500 index from May 1 st to October 31 st – the ‘summer season' – and held cash in their account for the remainder of each year the account would be worth $916. During that 56 year period an investor in the stock market using this seasonality strategy would have lost money.
Historical market data indicates that all of an investor's gain would have been generated during the winter season's six months. Further, researchers have found that this seasonal impact is pervasive – present in numerous countries, significant in size, and statistically robust over time.
Wall Street has long been aware of this seasonality trend, generating an old maxim to “sell in May and go away”. Financial journalist Mark Hulbert recently discussed the topic:
The odds of success [in timing the market] would certainly not appear to be very high. After all, market timers in general have very poor success rates, rarely doing better over the long term than simply buying and holding. Why would we think that they can do any better timing their entries and exits in October and April than in any other month of the year? . . .
Perhaps the most comprehensive review of its historical legitimacy appeared in the December 2002 issue of the prestigious academic journal, American Economic Review. It was reported there that in 36 of 37 countries studied, average stock market returns from Halloween through May Day (the so-called "winter" months) were significantly higher than equity returns from May Day through Halloween (the "summer months").
In fact , the study found, the summer months' returns have averaged so much less than those of the winter months that almost all of the stock market's long-term returns have been produced during the winter months . That implies that simply going to cash between May Day and Halloween will have only minor impact on long-term returns while dramatically reducing risk -- a winning combination that would show up in a much improved risk-adjusted performance.
The Halloween [seasonality] Indicator is thus in the rarefied ranks of those select few market timing systems that truly appear to work . . .
Seasonality Impact International in Scope
The long term seasonality trend is not just apparent in the U.S. stock markets – it is international in scope. The U.K. 's FTSE All-Share index, an index that tracks hundreds of companies traded on the London Stock Exchange and is considered by some as one of the best measures of the London equity market, has exhibited a powerful seasonality trend over the last forty years. The summer season returns of the All-Share index has outperformed the winter season by roughly 12% per year during this four decade long period.
Over the last ten years (since 1997), the "Sell in May" strategy for the U.K. FTSE All-Share index has gained 95 per cent, while the "Buy in May" strategy has lost 19 per cent. The All-Share is up 57 per cent for those who remained continuously invested.
“This is not due to a few one-off events” according to an article in the Financial Times by journalist John Authers. “Over every three-year and five-year period since 1980, these results have held good. Selling in May always wins. This also holds true whether the money held out of the market is parked in bonds, or cash, or hidden under the mattress.”
Recent Seasonality Data in the U.S. Markets
Because the long term seasonality trend appears to be robust and global in nature we expected investment managers would have discovered these pricing patterns and exploited the market inefficiencies, thus reducing the seasonality effect. We also expected the seasonality factor to apply more forcefully to the S&P 500 index – an index of the stocks of larger more liquid companies held by many mutual and pension funds and one that is widely used as a benchmark by active managers.
To test these expectations we examined the last eight years of market data, specifically the returns of the S&P 500 Index, the Russell 2000 Small Capitalization Index, the Dow Jones Industrial Index, and the Nasdaq Composite Index.
We assumed that the investor was only invested in the market for the six-month winter or summer season. The remainder of the year the individual was invested in cash, with no interest earned on the cash balance.
We found, somewhat to our surprise, that the seasonality factor was strong and clearly evident in the recent data – and it appeared across all the market indexes we examined. A summary of our findings for the eight year period ending November 1 st is as follows:
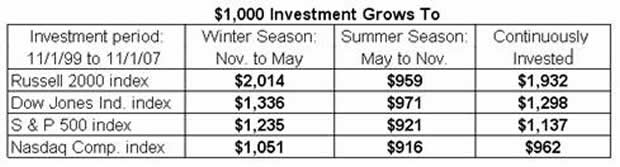
Investors can gather several points from this eight year subset of market data:
• The seasonality factor was clearly evident during this time period in all the indexes we studied
• Returns from the winter season substantially exceeded those for the summer season for every index
• In each case, returns from the winter season exceeded the returns of being continually invested for the entire 12 months, before tax
Seasonality & Investment Strategy
A simple strategy of entering the S&P 500 index on the first day of November and exiting on the first day of May each year would have outperformed the total return of the S&P 500 Index during the last 8 years – as well as for the last 56 years. The excess returns would have been generated with less market risk, since an investor would be in cash for six months out of each year.
This is a remarkable finding when you realize that the majority of professional money-managers and mutual funds are unable to match the performance of the S&P 500 index over the longer term.
If the market is as efficient as many claim, and if professional money managers as a group cannot consistently beat the S&P 500 index over the longer term, the question we have as an investment manager is why does this investment anomaly exist – and why is it so powerful?
One theory is that investors and institutions receive large amounts of cash every fall and allocate a portion of those funds into the stock market. The cash comes in the form of dividend and capital gains distributions, year-end contributions by employers or employees into their 401k plans, IRAs, and profit-sharing plans, and from annual bonuses. It also comes from small businesses and partnerships that calculate their earnings for the previous year, and distribute those assets to the owners during this period. Income tax refunds are also a source of cash.
The new funds being invested increase the demand for shares, propelling stock valuations higher in the fall and early winter. By late spring those monies have been invested, and the demand for stocks decline during the summer months.
Other theories, a bit less credible, attribute the performance differences to the fact that many financial managers are less attentive to their portfolios during the summer. Or that the change in daylight hours makes the manager more or less risk adverse, impacting returns. Others suggest most mergers and acquisitions are in the winter months, fueling stock prices.
In the end numerous theories exist. Exactly why the seasonality impact occurs is still open to academic debate.
Investment Implications
In our opinion the investment implications of the seasonality effect are truly remarkable. Note several attributes of the seasonality effect:
• The seasonality effect is present in both longer and shorter term market data, indicating the excess returns have not been arbitraged away in recent years. In theory the excess returns from this effect can still be exploited by active managers
• The size of the seasonality effect historically has been quite significant – larger than most other statistical related impacts we have examined – and the impact compounds over time
• The seasonality effect is present in all the major market indexes that we examined, even in international indexes, which indicates the effect is persistent, widespread and robust – regardless of the cause
• From the data it would appear that in general the more volatile the index or portfolio the more pronounced the seasonality effect, at least over the last eight years. The Nasdaq Composite index is the exception - it appears from the historical data the returns of that index in this period were distorted by the 2000 technology bubble
Keep in mind the eight years of data may not reflect long term trends and may not be statistically significant. The time periods covered by the data include three very volatile periods – one was the technology bubble in 2000, the events of September 11th , and the energy spike after the hurricanes in 2005. These volatile periods will potentially distort long term trends. The economy has not been through as many cycles as the 56 year period covered by the Ned Davis Research database.
It is also important to note that in some years the ‘winter season' produces sub-par or even negative results. It is the cumulative impact on returns over time that is impressive. There is no guarantee that investors in a ‘winter season' will generate gains – and in some cases investors lost money investing in stocks in this six-month period.
Summary
Our study of historical data indicates that over the longer term the six ‘winter' months will most likely be the most productive period for investors from a total return standpoint. As financial journalist Mark Hulbert points out, the “indicator is thus in the rarefied ranks of those select few market timing systems that truly appear to work.”
By Joseph Dancy,
Adjunct Professor: Oil & Gas Law, SMU School of Law
Advisor, LSGI Market Letter
Email: jdancy@REMOVEsmu.edu
Copyright © 2007 Joseph Dancy - All Rights Reserved
Joseph R. Dancy, is manager of the LSGI Technology Venture Fund LP, a private mutual fund for SEC accredited investors formed to focus on the most inefficient part of the equity market. The goal of the LSGI Fund is to utilize applied financial theory to substantially outperform all the major market indexes over time.
He is a Trustee on the Michigan Tech Foundation, and is on the Finance Committee which oversees the management of that institutions endowment funds. He is also employed as an Adjunct Professor of Law by Southern Methodist University School of Law in Dallas, Texas, teaching Oil & Gas Law, Oil & Gas Environmental Law, and Environmental Law, and coaches ice hockey in the Junior Dallas Stars organization.
He has a B.S. in Metallurgical Engineering from Michigan Technological University, a MBA from the University of Michigan, and a J.D. from Oklahoma City University School of Law. Oklahoma City University named him and his wife as Distinguished Alumni.
Joseph Dancy Archive |
© 2005-2022 http://www.MarketOracle.co.uk - The Market Oracle is a FREE Daily Financial Markets Analysis & Forecasting online publication.