


Stock Market Potential Long Term Topping Process Underway
Stock-Markets / Stock Markets 2011 Jun 09, 2011 - 03:00 AM GMTBy: Steven_Vincent

 In the introduction to this report, I detailed many of the non-technical elements that should have happened and could have happened and almost happened--but that ultimately failed to happen--leading to a non-confirmation of an ongoing bull market. Let's reiterate: I gave the bull the benefit of the doubt and argued its cause to the extent that it gave a cause to argue. But when reality departs from argument I will have to go with reality. Let's look at some technical factors which failed to confirm an ongoing bull market and give substantial cause to anticipate a renewed bearish environment.
First let's examine a long term chart of SPX:
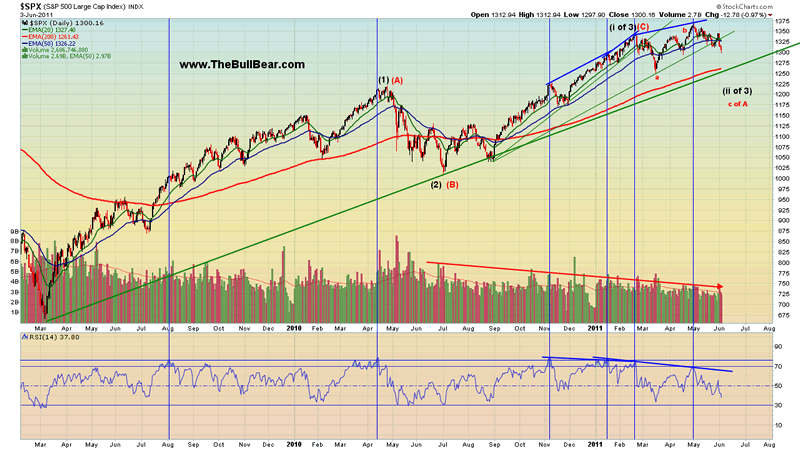
Since the August/September 2010 bottom, we have been operating under the thesis that SPX was probably in a bullish Wave 3 advance. If this is the case, there are some technical characteristics which should be present and some which should not be present. Separately, the persistently declining volume over the course of entire run and the successive RSI divergences are not necessarily troublesome, but together they add up to a technical non-confirmation and make the move much more likely to be a C wave. If the 50 MA of volume starts to turn up and volume levels persist above the 50 MA during an ongoing decline, that will probably be a long term bear signal. If RSI declines below 30 and breaks its March 2009 low, that would also be another confirmation of a bearish shift.
The 50 EMA of Advances-Declines is testing its key support zone from which intermediate term rallies have been initiated many times since March 2009:
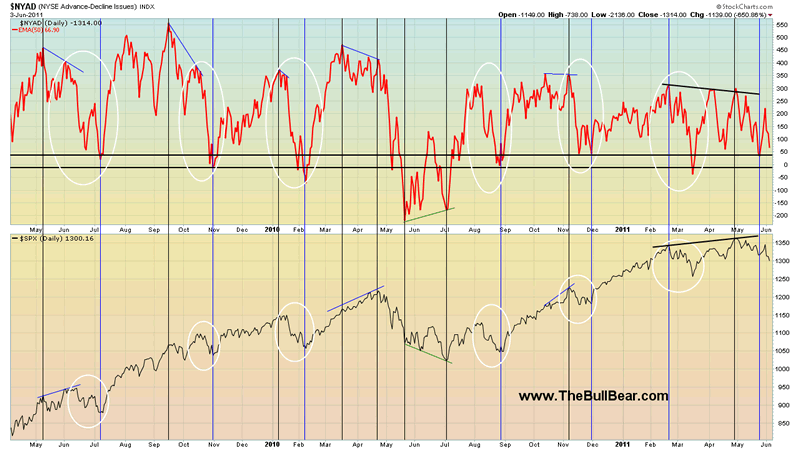
Of course, it's possible that it may rally sharply off this support zone again and the market may reverse. But there are some signs that that is not what is going to happen this time. First, note that the indicator has made lower highs as the market made higher highs--a bearish divergence. Second, note that the indicator recently bounced off of support but failed to attain a new high before heading back down again. Also note that the indicator is now nearly at its support level after a minor sell off in the market. This means that if the market breaks support this week the indicator is likely to also break through support and head back down to its May or July 2010 lows or below. This would likely represent a bearish range shift for this indicator and the markets.
Percent of Stocks Above 200 EMA has broken down badly:
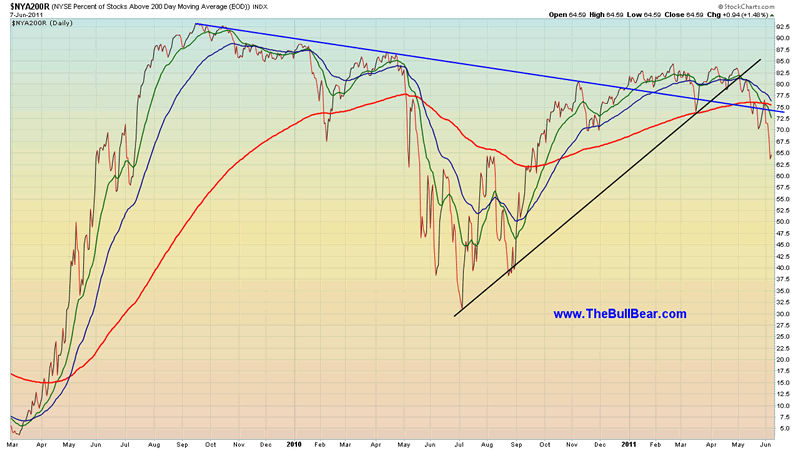
This is just one example of the many indicators that are leading the markets lower. The indicator has declined to readings well below the March and November lows while market price has not yet even taken out the March lows. Generally when technicals lead a market lower it is a good signal that market price will follow soon.
While the situation described thusfar could certainly reverse and propel markets higher, the important point to be grasped here is that on every count there have been significant attempts to move in a direction that would be bullish for stocks and general asset prices that have FAILED badly and REVERSED strongly in the opposite direction. What makes this even more inauspicious is the total failure of the trading and investing community to come to recognize and come to terms with the situation. Trapped in attachment to to established views they may be forced to reckon with reality all of a sudden, producing a steep, sudden decline in prices as everyone heads for the exit at the same time.
In the short term a minor rally is possible as there may be a bit of short term selling exhaustion and a bit too much bearishness creeping in to the markets. if there is a rally, the next minor high should be a good shorting opportunity for the next wave down, which will likely be the strongest move down seen yet this year.
To read the full BullBear Market Report, please join us at BullBear Traders room at TheBullBear.com.

Disclosure: No current positions.
By Steve Vincent
Steven Vincent has been studying and trading the markets since 1998 and is a member of the Market Technicians Association. He is proprietor of BullBear Trading which provides market analysis, timing and guidance to subscribers. He focuses intermediate to long term swing trading. When he is not charting and analyzing the markets he teaches yoga and meditation in Los Angeles.
© 2011 Copyright Steven Vincent - All Rights Reserved Disclaimer: The above is a matter of opinion provided for general information purposes only and is not intended as investment advice. Information and analysis above are derived from sources and utilising methods believed to be reliable, but we cannot accept responsibility for any losses you may incur as a result of this analysis. Individuals should consult with their personal financial advisors.
© 2005-2022 http://www.MarketOracle.co.uk - The Market Oracle is a FREE Daily Financial Markets Analysis & Forecasting online publication.