


What the U.S. Dollar & the Euro Mean to the S&P 500
Stock-Markets / Stock Markets 2011 Jun 12, 2011 - 03:15 AM GMTBy: J_W_Jones

 The buzz around the blogosphere and in the media is that Quantitative Easing II is scheduled to end in around 3 weeks. Already pundits are asking about Quantitative Easing III as a matter of when, not if. In reality a QE III Lite version is already in the cards as the Federal Reserve has stated they will be buying Treasuries and Mortgage Backed Securities (MBS) with maturing issues. The Fed also plans on reinvesting the interest earned from the existing portfolio (Roughly $15 billion/monthly).
When it comes to the application of financial principles, doing the opposite of what everyone else does generally leads to an extreme variation in the overall results. While the results are not always better, they are at the very least significantly different from what most lemmings within the group experience. In every aspect of my financial life I try to do the opposite of what the herd is doing. It takes experience and a significant level of discipline, but buying from the herd when they are selling and being willing to sell into a crowd when they are buying is a great way to trade. It sounds easy, but for most people it is not, myself included.
Right now financial markets are uncertain. I would be remiss if I did not point out the recent strength in the U.S. Dollar Index and the potential higher low that it has carved out on the daily and weekly charts. The weekly chart of the U.S. Dollar Index is shown below:
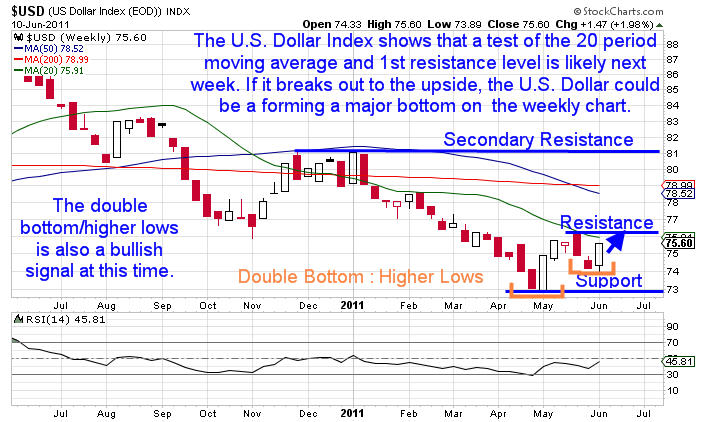
The current pattern on the U.S. Dollar Weekly chart is bullish. We could see the U.S. Dollar Index trade significantly higher from here as it has been under severe selling pressure for an extended period of time. While I believe technical analysis is just one context through which to view financial markets, it is uncanny how often market cycles and headline events line up. Is it merely a coincidence that the U.S. Dollar is potentially bottoming around the same time the Federal Reserve is ending the QE II asset purchase program?
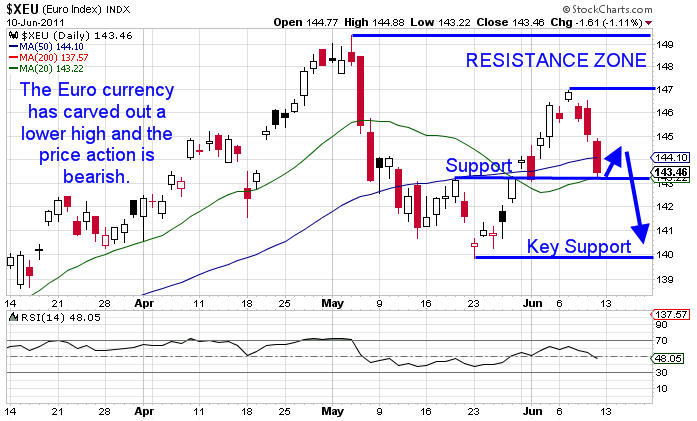
Regardless of what camp economists are in, we presently live in a strange time for financial markets and capitalism in general. One of the more interesting charts to study is the Euro currency, which in contrast to the U.S. Dollar Index appears to have a more bearish pattern. Could it be that the U.S. Dollar is setting up to rally because of the perceived weakness of the Eurozone? The daily chart of the Euro ETF is shown below:
The Dollar may be firming up here based on the Euro’s weakness and it may have absolutely nothing to do with QE II ending. I always refer to price action and never question Mr. Market’s directional bias. If the U.S. Dollar begins to work higher what impact will it have on equities?
A stronger U.S. Dollar would certainly put pressure on risk assets, specifically equity and commodity prices. As it turns out, we are at an interesting juncture in financial markets at this point in time.
The 4 year stock market cycle is nearing an end, a presidential election will take place in less than 18 months, the U.S. government has a massive debt crisis developing, and the European debt crisis continues to mature in what will likely be a microcosm of what we will face here in the United States. The Middle East remains tense at the very least and the recent OPEC announcement to maintain supply levels has helped support oil prices.
Higher oil prices have obviously slowed down the U.S. economy as the consumer is strapped with higher costs on nearly everything, specifically food and energy. In addition, the unemployment numbers are seemingly not improving and housing appears to be rolling over . . . again.
Almost everywhere we look the news is bleak. Mr. Market has shrugged off bad news time and time again since the March 2009 lows. The long term shorts remain frustrated to say the least and those who were actively shorting along the way have likely been stopped out multiple times. Everywhere I look market commentary is bearish and pundits are talking about additional weakness as they point to a rallying Dollar and multiple economic headwinds facing domestic markets.
Traders and investors should be focused on a few specific price levels on the S&P 500. With the Dollar rallying, the S&P 500 index has remained under extreme selling pressure for multiple weeks. The S&P 500 (SPX) is likely going to test its 200 period moving average. From there I am expecting a bounce higher, although the bounce may be nothing more than a Dead Cat Bounce.
As always, time and price will be the final arbiter but if the Dollar continues to trade higher we could see the S&P 500 lose its 200 period moving average and eventually test a major support level which needs to hold up for the bulls. If the March 16, 2011 pivot lows are taken out to the downside, the next leg of the secular bear market may be under way. The daily chart of the SPX illustrated below shows the key price levels and the potential price action that may lead up to a key test of the March 2011 pivot lows:
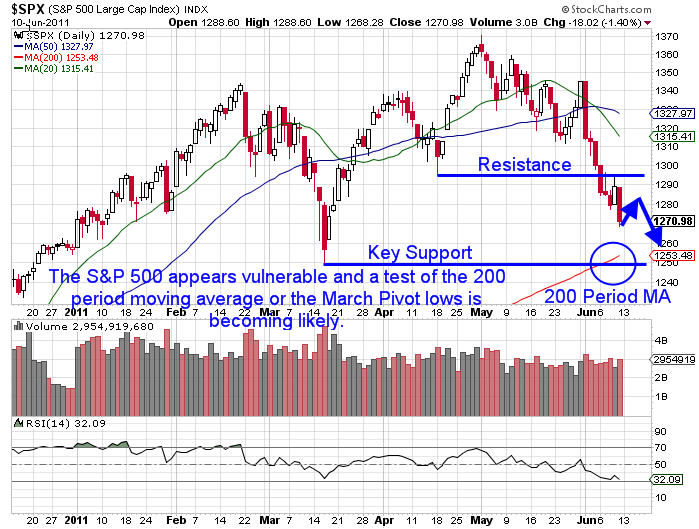
Very rarely does the first mouse get the cheese, so I would anticipate a bounce off of the 200 period moving average which currently coincides with the March pivot lows. With not only the pivot lows but the 200 period moving average offering support a breakdown lower will be a large tell about the health and future price action of the S&P 500.
Right now I am just going to focus on how the S&P 500 handles the key support zone illustrated above. The forthcoming price action will tell traders everything we need to know about the health of financial markets. I have no idea if we are about to enter a double dip recession nor do I know whether price action will even test the March pivot lows.
What I do know is that price action in coming days around key support areas is going to be critical. I am convinced that Mr. Market will tell us whether the bullish party will continue or come to an end in the next few weeks/months. A breakdown of the March pivot lows in the future will likely initiate the launch sequence for the next secular bear market. I would keep the S&P 500 1,250 price level on the radar going forward. Risk remains high.
If you would like to be informed several times per week on SP 500, Volatility Index, Gold, and Silver intermediate direction and options trade alerts… take a look at http://www.optionstradingsignals.com/specials/index.php today for a 24 hour 66% off coupon, and/or sign up for our occasional free updates.
J.W. Jones is an independent options trader using multiple forms of analysis to guide his option trading strategies. Jones has an extensive background in portfolio analysis and analytics as well as risk analysis. J.W. strives to reach traders that are missing opportunities trading options and commits to writing content which is not only educational, but entertaining as well. Regular readers will develop the knowledge and skills to trade options competently over time. Jones focuses on writing spreads in situations where risk is clearly defined and high potential returns can be realized.
This article is intended solely for information purposes. The opinions are those of the author only. Please conduct further research and consult your financial advisor before making any investment/trading decision. No responsibility can be accepted for losses that may result as a consequence of trading on the basis of this analysis.
© 2005-2022 http://www.MarketOracle.co.uk - The Market Oracle is a FREE Daily Financial Markets Analysis & Forecasting online publication.