


Time For Stock Market Reversal Drawing Closer
Stock-Markets / Stock Markets 2011 Jun 13, 2011 - 04:17 AM GMTBy: Andre_Gratian

 Very Long-term trend - The continuing strength in the indices is causing me to question whether we are in a secular bear market or two consecutive, cyclical bull/bear cycles. In any case, the very-long-term cycles are down and, if they make their lows when expected, there will be another steep and prolonged decline into 2014-16.
Long-term trend - In March 2009, the SPX began a move which evolved into a bull market. Cycles point to a continuation of this trend for several more months.
SPX: Intermediate trend - The intermediate trend is still intact. After the 1370 projection was reached, the SPX started a normal consolidation pattern which is ongoing, but nearly complete. The intermediate uptrend is expected to resume afterwards. (no change this week)
Analysis of the short-term trend is done on a daily basis with the help of hourly charts. It is an important adjunct to the analysis of daily and weekly charts which discusses the course of longer market trends.
Last week, the SPX shed another 29 points. This brings the index to a total decline of about 100 points in the space of six week. Is it done yet? Before we get into that, let's ask an expert what kind of a decline this is. At the 1370 top, the VIX was at about 14. In the course of the downtrend, it reached a high of about 20. And last Friday, it closed just below 19.
Clearly, Mr. VIX is not too worried about the extent of this correction. During last year's intermediate correction, the VIX went from about 15 to a high of about 48. If this is how the VIX behaves in an intermediate correction, we have to deduce that we are not in one, but only in an extended short-term correction period, and that the intermediate trend is most likely still up! Of course, the VIX could still wake up and forecast much more decline ahead but, until it does, we have accept what it is telling us and not dwell on what it is not.
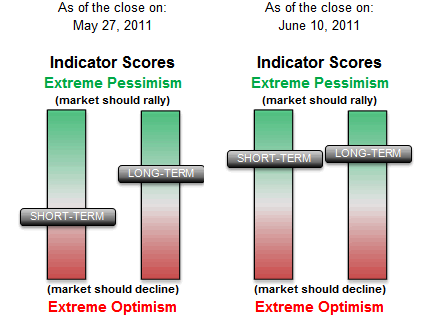
Now, is it done yet? We can ask another expert: The SentimenTrader what it thinks, and its answer is: "I can't tell you that exactly because I am not a timing indicator, but I feel that we are pretty darn close!" (We'll see a picture of the "SentimenTrader" a little later on.)
That's too vague! Perhaps we can get more specific answers, from our charts.
Chart Analysis
When analyzing the market, it's always best to start with the long term and move to shorter time frames. Therefore, we'll first look at the Weekly SPX Chart.
At first glance, it looks as if the bull market is merely changing its degree of ascent from a very steep trend to a more moderate one. I have drawn the new channel and its median, and this is where the SPX came to rest on Friday. For a number of reasons that we'll go into later, it could find good support there. The MSO is oversold and the daily and hourly indicators seem to be probing for a low. That does not mean that we'll get back into an uptrend right away. As supply and demand forces come into equilibrium, we could have a lateral move which builds a base, and when demand begins to overcome supply, we could continue the uptrend.
In addition to potential support from the median, we are coming into the low of the Armstrong 8.6-yr cycle. Although this is a business cycle and not a stock cycle, it has coincided with reversals of some indices in the past. As an example, the XLF made the first of its double-top on the February 2007 PI cycle date. As we'll see as we progress through our analysis, evidence supporting a near-term reversal is beginning to pile up.
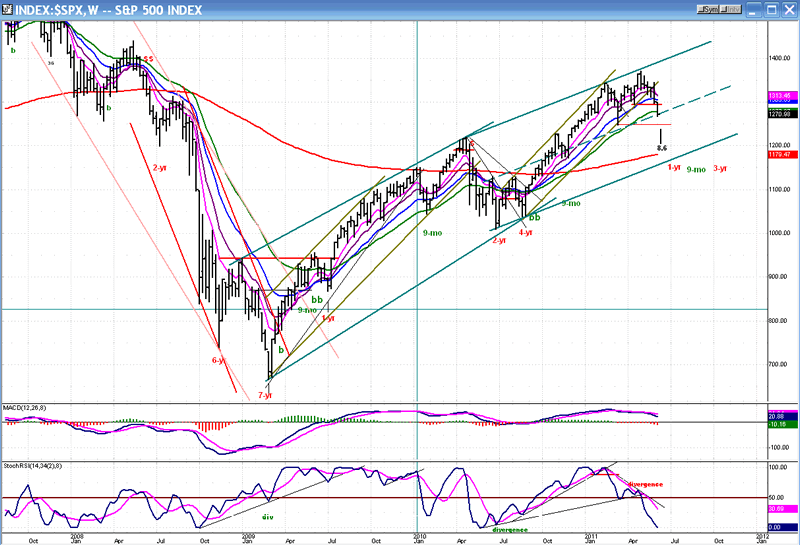
Even though the VIX is not predicting a decline of intermediate nature, one could argue that, in fact, we have cleanly broken out of the intermediate channel in which stocks were rising precisely at the same angle as the first intermediate up-leg from the March low. What we call this correction does not matter as much as finding out when it will come to an end.
We'll continue our detective work with the Daily Chart.
The median is also shown on this chart at exactly the half-way point of the channel. By re-adjusting the channel lines, we now have an index which is still trading in the top part of the new channel and, until it moves into the lower half, it is not showing any long-term weakness.
The short-term red down-channel from the top is drawn by connecting the first three lows of the decline, and then drawing a parallel at the 1370 high. I believe that this was the original channel of the downtrend, and when the index failed to move out of it on 5/31, enough selling developed to send prices through the bottom line. So far, the original channel has expanded by 1.68 or the width of the original and, on Friday, the SPX closed on the new lower channel line where it intersects with the median of the larger channel.
Will it hold there? We'll find out next week! The Armstrong cycle low is scheduled for Monday or Tuesday but it could have bottomed on Friday for a number of reasons which we will discuss as we continue our analysis. But let's now look at the daily indicators.
The top one (the MACD) is in a downtrend, with only the barest signs of deceleration over the last two days of trading in its histogram. For sure, that's not the indicator that will be the first to signal a reversal of the trend. The next one (the MSO) is in slightly better shape. It has made a double-bottom and, on Friday, it refused to go to the low of its range once again, while the market had an 18-point down day. I know! That's pretty slim pickings in terms of positive divergence, but this shows up much more clearly and forcefully in the hourly indicator. Finally, the A/D oscillator is also showing some minor divergence. Incidentally, look how the three bottoms of that oscillator -- which represent the three lows of the decline where I chose to draw my first channel line -- also line up, exactly.
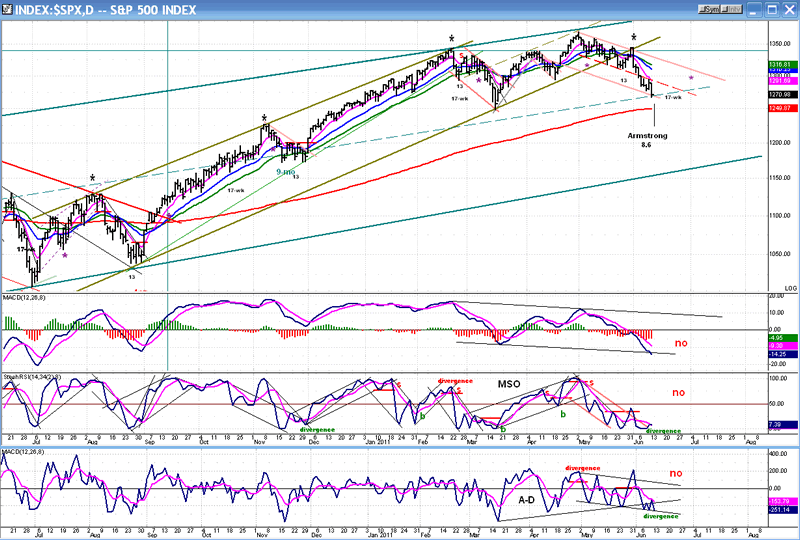
We conclude that the faintest signs of bottoming action may be appearing in the daily indicators, and also note that the index is only 20 points above its 200-DMA where it should find good support if it keeps on declining.
Let's push forward with our investigation by looking at the Hourly Chart.
The SPX ended the week at the bottom of its correction channel. During the week, it attempted two rallies. Both were defeated by the resistance that it met at the bottom line of the original channel. It's obvious that, for a bona fide reversal, it will have to trade not only above that line, but above the last two near-term highs which happen to be at about the .382 retracement level of the decline from 1345. If we were to open up on Monday morning and extend the bounce from Friday's low of 1268, we might not be able to clear those highs right away because not enough of a count has been established in the small P&F base which was built by Friday's action.
Based on that consideration, and on the fact that the A/D closed very weak on Friday and shows no positive divergence in its oscillator (bottom), we might need to do a little more base-building before being able to reverse.
Also, the Armstrong cycle low is expected to be either Monday or Tuesday, and this could mean a new low before we can turn up. It's easier to fine-tune the market in real time when it is trading and we can analyze the price action, than trying to guess what it's going to do the following day. So we'd better wait until Monday to see what it does.
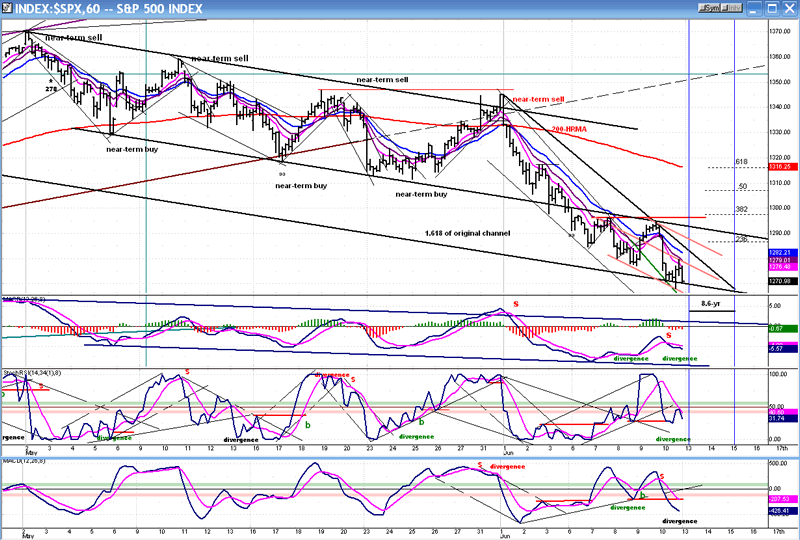
Even though the decline has been unrelenting, there are some definite signs of deceleration which tell us that selling is somewhat drying up. The small red channel at the bottom of the chart is at a more gentle angle than the black channel from 1345. This is also reflected in the momentum indicators which are showing some positive divergence. The last two bounces represent attempts at reversing. The last one gave up after touching the downtrend line. The next one may be more successful and be able to get out of the small channel entirely. While this can happen at any time, it may be a while longer before we can get through the top of the short-term channel and trade above 1345 in order to reverse the short-term downtrend.
Cycles
The 14-15-week top-to-top cycle which was ideally due on 6/6 came in a few days early and is probably (in part) responsible for the decline from 1345.
The other component fostering the decline is most likely Martin Armstrong's 8.6-yr economic cycle which is due on 6/13-14. The market action seems to suggest that it could bring about a reversal, and thus end the correction.
The 17-wk cycle appears to have lost some of the dominance that it enjoyed in 2009-2010, but can still have an effect on the market. It is due around 6/20.
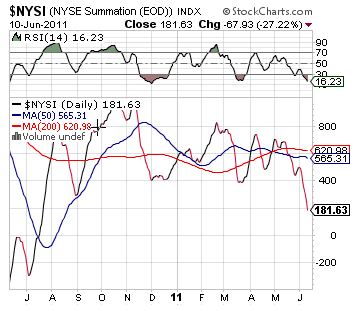
Breadth
The NYSE Summation Index (courtesy of StockCharts.com) pattern has pretty much followed that of the price. Another indication that the correction is close to being over is that the RSI is now oversold. Once it has reached that level, its past history shows that a reversal in the trend of the NYSI is near.
Sentiment
"The long-term SentimenTrader (courtesy of same) has grown more bullish with every market pull-back. This is a pattern which will inevitably result in a resumption of the intermediate-term uptrend for the SPX." This is what I wrote two weeks ago. You can readily see the bullish change that has taken place in the SentimenTrader since then.
I already mentioned the VIX at the beginning. It's complacency tells us that this is not a very important decline.
The QQQ normally leads the SPX. At best, its current relative strength to the SPX is neutral -- another sign that a smidge more time may be required before we end the correction.
Copper
There is a lot of concern about the health of the economy, so we decided to consult one more expert in that field: Dr. Copper! Let's see what he says!
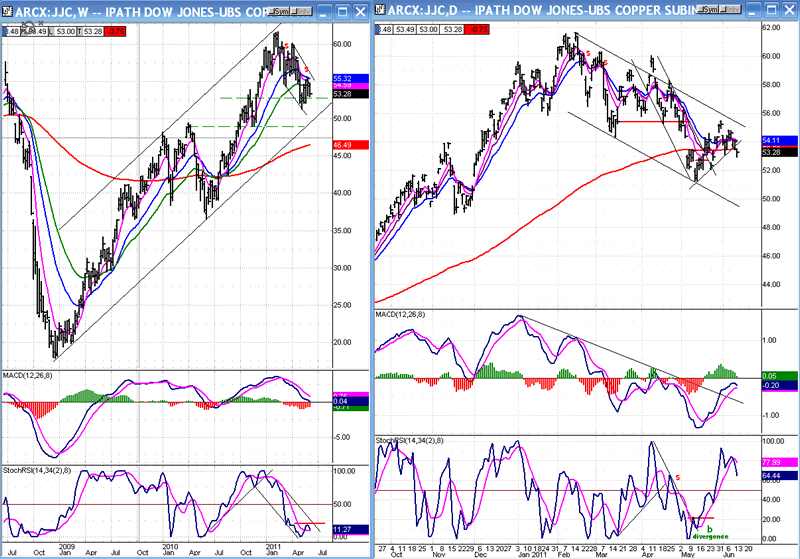
Because copper prices are closely tied to the industrial cycle, many analysts consider copper to be a leading economic indicator. Here are the weekly and daily charts of the copper ETF, side by side.
Initially, they look very similar to the charts of the SPX, but with a significant difference: the bull market for the SPX started on March 6, 2009 and copper started its bull run in late December '08, a little over 2 months earlier. What about the current correction? The SPX topped in early May, and copper? In mid-February! The consistency of Dr. Copper's prescience is impressive! But here comes the best part for the bulls: copper appears to have made a low on 5/11 by holding at its 200-DMA. However, it has not yet given a confirmed reversal signal. Therefore, we have two considerations:
1) Has it really bottomed? And 2) even if it has, that's only a month ago. If the normal time-span between the two indices is about 2 months, does that mean that the SPX won't make its final low for another few weeks? I back-tested the relationship of the two indices to see if what we've seen in the past two+ years holds up historically and, alas, it does not!
Because the copper ETF has a short history, I used FCX to compare its action vs. the SPX. In 2007, the SPX topped about 6 months before FCX. In 2000, FCX did top about 3 months before SPX, but in 2002, FCX bottomed two years before the market.
Conclusion? Most of the time, copper has served as a good stock market leader, but the span of time which separates the reversal of the two indices is inconsistent which behooves us to rely on more appropriate indicators for market timing.
Summary
It seems pretty clear - and logical -- that the time for a reversal is drawing closer, and it is conceivable that a low may have been made on Friday.
The Armstrong 8.6-yr cycle low is due Monday or Tuesday and it may have something to say about the timing of the reversal.
After we do reverse, we will have to decide if this is a rally in a downtrend, or the beginning of a move to a new high. If copper begins a new uptrend, it should give us some confidence that we have only experienced a "bump in the road to economic recovery".
FREE TRIAL SUBSCRIPTON
If precision in market timing for all time frames is something which is important to you, you should consider a trial subscription to my service. It is free, and you will have four weeks to evaluate its worth.
For a FREE 4-week trial. Send an email to: ajg@cybertrails.com
For further subscription options, payment plans, and for important general information, I encourage you to visit my website at www.marketurningpoints.com. It contains summaries of my background, my investment and trading strategies and my unique method of intra-day communication with Market Turning Points subscribers.
By Andre Gratian
MarketTurningPoints.com
A market advisory service should be evaluated on the basis of its forecasting accuracy and cost. At $25.00 per month, this service is probably the best all-around value. Two areas of analysis that are unmatched anywhere else -- cycles (from 2.5-wk to 18-years and longer) and accurate, coordinated Point & Figure and Fibonacci projections -- are combined with other methodologies to bring you weekly reports and frequent daily updates.
“By the Law of Periodical Repetition, everything which has happened once must happen again, and again, and again -- and not capriciously, but at regular periods, and each thing in its own period, not another’s, and each obeying its own law … The same Nature which delights in periodical repetition in the sky is the Nature which orders the affairs of the earth. Let us not underrate the value of that hint.” -- Mark Twain
You may also want to visit the Market Turning Points website to familiarize yourself with my philosophy and strategy.www.marketurningpoints.com
Disclaimer - The above comments about the financial markets are based purely on what I consider to be sound technical analysis principles uncompromised by fundamental considerations. They represent my own opinion and are not meant to be construed as trading or investment advice, but are offered as an analytical point of view which might be of interest to those who follow stock market cycles and technical analysis.
Andre Gratian Archive |
© 2005-2022 http://www.MarketOracle.co.uk - The Market Oracle is a FREE Daily Financial Markets Analysis & Forecasting online publication.