


Stock Market Looking to Make Summer Lows
Stock-Markets / Stock Markets 2011 Jun 13, 2011 - 06:53 AM GMTBy: Money_Morning

 Jon D. Markman writes:
With stocks down for the sixth straight week, we need to start looking at where we might expect to see the summer market lows.
Jon D. Markman writes:
With stocks down for the sixth straight week, we need to start looking at where we might expect to see the summer market lows.
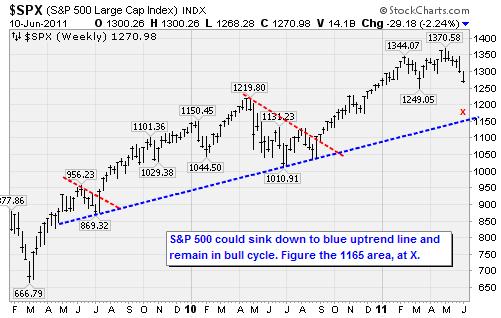
So here is the question to ponder: How far could the Standard & Poor's 500 Index sink during the summer and stay within its two-year, bull-cycle uptrend?
We can forget about the exact reasons this might happen -- there are ample candidates, ranging from the weak economy to withdrawal from quantitative easing -- and just focus on outcomes.
My answer is that it could fall as low as 1,137 to 1,192 -- so figure the middle of that range, with 1,165 as a target.
First, stare at the chart for a minute. What jumps out at you? The best uptrend line you can draw connects the two mid-summer lows of 2009 with two mid-summer lows in 2010. Hmm.
In those two years, we were coming out of a terrible bear market, but at least there was some optimism that business, credit, consumers and employment trends were recovering. Central banks around the world were in sync, providing incredible liquidity. Economies were in a recovery mode.
Now fast-forward to this year and optimism seems to have vanished, central banks are out of sync, the U.S. and Japanese economies are sputtering, and liquidity is about to be withdrawn. In that context, why would this be the only year in which there were no summer lows to attach to the dotted line?
The Dotted Line Prophecy
There are a lot of fancy statistical ways to determine how big a decline might be necessary to fulfill my Dotted Line Prophecy.
But often the simplest way works best.
Figure the first decline marked by a red line, from 956 to 869, amounted to a 9% drop. Then the next decline, from 1,219 to 1,010, amounted to a 17% decline. Average and weight them to get a potential 15% drop. That gets you to 1,164.
Note that 1,164 is where the line will be by around mid-August if you project it out. So it has a certain air of destiny about it.
If we see this drop, there will be no shortage of reasons for it. Yet try to remember all the reasons for last summer's 17% decline. I seem to recall something about the dollar, Greek debt, maybe a little Portuguese something or other, probably some earnings warnings.
But eventually the game always comes back to corporate earnings growth and expectations, and liquidity supplied by central banks. It turned out companies were able to figure out how to turn a profit even though revenue growth had stalled. And it didn't hurt that U.S., Chinese and European central banks helped grease the skids by printing more money.
The point here is that a sizeable decline could occur and it would not be the end of the world, or even of the bull market. At some point, unless the earth has really gone off its axis, the politicians and central banks will gin up a reason to crank up the printing presses again and survivors like Altria Group, Inc. (NYSE: MO), International Business Machines, Corp. (NYSE: IBM) and Caterpillar Inc. (NYSE: CAT) will show they were able to adapt and thrive once again.
Bottom Line: Expect a bottom sometime during the next five days amid options expiration week, followed by a modest summer rally. Once the current oversold condition is relieved, expect to batten down the hatches for a couple of months. I had hoped we would be able to avoid this, but it's beginning to look like it is baked in the cake.
Downside Day
Stocks closed broadly lower over the past week in the wake of increasing wariness about the firmness of the global economic recovery and an increase in fretfulness regarding European sovereign debt.
The Dow Jones Industrial Average fell 1.6% over the past week to close below 12,000 for the first time since shares rambled lower following the earthquake in Japan. The S&P 500 lost 2.2% for the week, the Nasdaq Composite sank 3.3% and the Russell 2000 small-cap index dropped 3.5%.
The week closed with a 90% Downside Day, which means that 90% of stocks and 90% of volume was on the downside, and follows a 90% downside day earlier in the week. When these start to cluster up, the market tends to experience a washout and decks are cleared for a rebound.
We prepared for this turn of events by selling funds earlier in the month, and holding about 75% cash in our RiskTaker portfolio and utilities in our stock portfolio.
The utilities tend not to be economically sensitive because they have monopolies and government-regulated rates. They have weathered a hundred storms in the past and come out the other side with their sails still right side up.
On the corporate front on Friday, The Travelers Companies, Inc. (NYSE: TRV), a big insurance company, announced it would cut back on share repurchases due to larger-than-expected catastrophe losses this year. Shares were kind of a catastrophe themselves, falling 3% to break a solid 10-month uptrend.
On the plus side, good news for the stretchy pants set: Lululemon Athletica Inc. (Nasdaq: LULU), the trendy maker of the yoga pants that seem to be taking over the fashion of hip cities like Seattle and San Francisco, beat earnings forecasts and offered a positive outlook for the coming year. Shares rose 4.4% on the news.
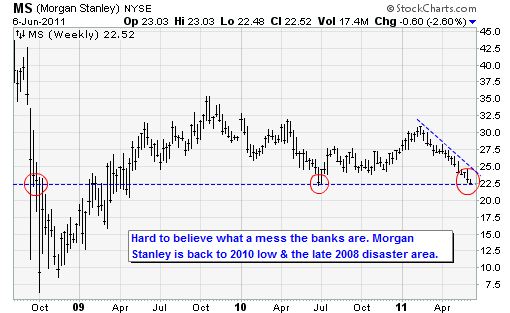
However, financial companies have been the hardest hit victims of the selling, down 10% since the beginning of May and down 7% since the start of the year. We have been avoiding them because they suffer the most from the slowdown in credit growth, stock trading and home building.
After the credit crisis in 2008, many of them merged, thus avoiding a needed period of restructuring. They have too many employees, too many costs and not enough business. Margins are down, revenues are down, and costly regulations are up -- a bad combination.
I expect banks are going to have to right-size themselves this year by firing a lot of middle managers. I really hope that does not happen, but I don't see how the banks can avoid it. Their expenses structures are completely out of synch with income.
Once you realize that big companies like Bank of America Corporation (NYSE: BAC), Morgan Stanley (NYSE: MS), and Goldman Sachs Group, Inc. (NYSE: GS) could come under a lot more pressure, even trading at incredibly low multiples to book value, it's logical to assume the major investment indexes could get hit really hard this summer.
No QE3, But Maybe...
A number of political and economic events could serve as the spark for a multi-week rebound. One would be a NATO victory in Libya that kicks out Col. Moammar Gadhafi, puts a new government in his place, which would likely knock the price of crude oil down by $10 to $20 per barrel.
Another catalyst could be a budget deal by Democrats and Republicans. And a third would be renewed hints that the U.S. Federal Reserve plans to launch a third round of quantitative easing once the current round (QE2) ends this month.
Of these, the market would love to see the third most of all -- yet I think it is the most unlikely.
And here's why, along with some background. I'm going to lean on some research by Paul Ashworthof Capital Economics in Toronto for this analysis.
First, the economic slowdown we've seen so far could be largely due to temporary factors, such as the supply disruption from the Japanese earthquake, and the surge in commodity prices stemming from the revolutions in North Africa. Neither of these are long-lasting phenomena. Fed officials will want to see if growth accelerates again in the second half of the year.
In his speech on the economic outlook this week, Fed chief Ben Bernanke said the economic recovery had recently suffered a "loss of momentum," but that he still expects growth to pick up again.
Equally important is that the latest round of quantitative easing does not appear to have cut long-term interest rates much, and may have contributed to higher commodity prices. So the Fed is on the verge of determining that the costs of QE have undermined the benefits.
The Fed may conclude, in short, that QE2 - the large-scale purchases of bonds with the intent of driving down real interest rates and boosting business investment -- was an experiment that failed. For despite the massive monetary stimulus pushed into the system, the payoff has been punk. GDP growth averaged only 2.9% last year, will fall to 2.5% this year, and is on track for 2% next year.
The gift store at Fed headquarters should sell a souvenir crewneck: "My government spent $600 billion on Treasurys and all I got was this lousy T-shirt."
Of course, this doesn't mean another round of quantitative easing will never happen again. If the economy remains soft, the Fed may be tempted to use some form of QE next year to offset what Bernanke called "an increasing fiscal drag on the recovery."
So what might the Fed do? Hard to say, but it will do something. Bernanke has proven to be creative and bold over the past few years -- you never know what kind of tricks he may have up his sleeve. It may not be QE3, but expect a surprise by the fall.
The Week Ahead
Monday June 13: No economic releases planned
Tuesday June 14: Producer price index for May; Retail sales in May; Business inventories in May
Wednesday June 15: Consumer price index in May; Empire State manufacturing index for early June; Industrial production for May
Thursday June 16: Housing starts in May; Initial jobless claims for week of June 11; Philadelphia Fed survey for week of June 11
Friday June 17: Quadruple witching (expiration of equity options, commodity futures, financial futures, futures options); Reuters/University of Michigan Consumer Sentiment; Conference Board Index of Leading Indicators
[Editor's Note: Money Morning Contributing Writer Jon D. Markman has a unique view of both the world economy and the global financial markets. With uncertainty the watchword and volatility the norm in today's markets, low-risk/high-profit investments will be tougher than ever to find.
It will take a seasoned guide to uncover those opportunities.
Markman is that guide.
In the face of what's been the toughest market for investors since the Great Depression, it's time to sweep away the uncertainty and eradicate the worry. That's why investors subscribe to Markman's Strategic Advantage newsletter every week: He can see opportunity when other investors are blinded by worry.
Subscribe to Strategic Advantage and hire Markman to be your guide. For more information, please click here.]
Source :http://moneymorning.com/2011/06/13/losing-streak-sends-sp-500-looking-for-summer-market-lows/
Money Morning/The Money Map Report
©2011 Monument Street Publishing. All Rights Reserved. Protected by copyright laws of the United States and international treaties. Any reproduction, copying, or redistribution (electronic or otherwise, including on the world wide web), of content from this website, in whole or in part, is strictly prohibited without the express written permission of Monument Street Publishing. 105 West Monument Street, Baltimore MD 21201, Email: customerservice@moneymorning.com
Disclaimer: Nothing published by Money Morning should be considered personalized investment advice. Although our employees may answer your general customer service questions, they are not licensed under securities laws to address your particular investment situation. No communication by our employees to you should be deemed as personalized investent advice. We expressly forbid our writers from having a financial interest in any security recommended to our readers. All of our employees and agents must wait 24 hours after on-line publication, or 72 hours after the mailing of printed-only publication prior to following an initial recommendation. Any investments recommended by Money Morning should be made only after consulting with your investment advisor and only after reviewing the prospectus or financial statements of the company.
Money Morning Archive |
© 2005-2022 http://www.MarketOracle.co.uk - The Market Oracle is a FREE Daily Financial Markets Analysis & Forecasting online publication.