Gold, Commodities, Stocks and Dollar, What's Coming Next!
Stock-Markets / Financial Markets 2011 Jun 16, 2011 - 03:04 AM GMTBy: Anthony_J_Stills
 Every act you have ever performed since the day you were born was performed because you wanted something. ~ Andrew Carnegie
The media is asking a series of ignorant and self-serving questions that will only confuse the investor and I would like to shed some light on this. Yesterday the stock market rallied and the press immediately anointed the event as the precise moment when things started to get better. They're of course wrong.
In order for things to actually get better, you have to have an intelligent plan and that plan needs to be implemented by willing and capable people. Washington has no plan and there are no willing and capable people in Washington, only carpetbaggers. Then of course we have this infernal debate about the coming inflation when in fact inflation descended down upon us ten years ago and has probably run its course. Take a look at the chart twelve-year chart of the CRB Index and you'll see what I mean:
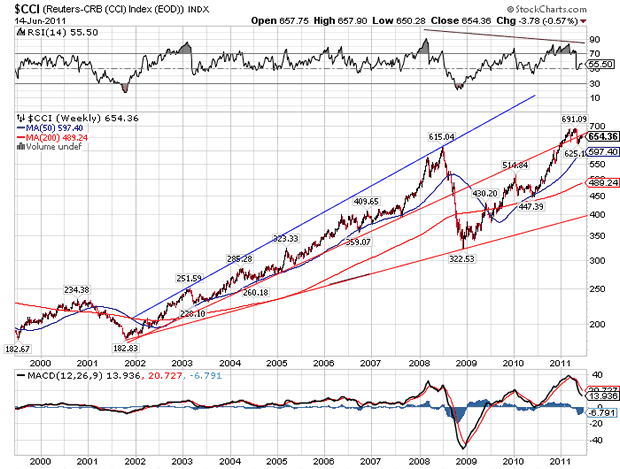
We had inflation but the government forgot to send you the memo! Some years saw prices jump as much as 50% and from trough to peak is surged almost fourfold. Now I think it more than likely has run its course and the CRB Index is making a lower high on its way to a serious decline.
The media knows its way behind the curve so it's now beginning to float the idea that we're in for what's called stagflation. Stagflation occurs when you have a combination of rising prices with declining growth. The declining growth in the US is now so obvious that a blind man could see it, but I think they're late to the party as far as rising prices are concerned. I think this is the case for a number of reasons. As I pointed out to you a couple of weeks ago, numerous commodities topped out back in January and February, and with the exception of corn nothing has changed to date. On Monday morning I told you that I had taken an initial short position in corn, wheat, oil and cotton: Take a look at what happened to the July corn futures contract since then:
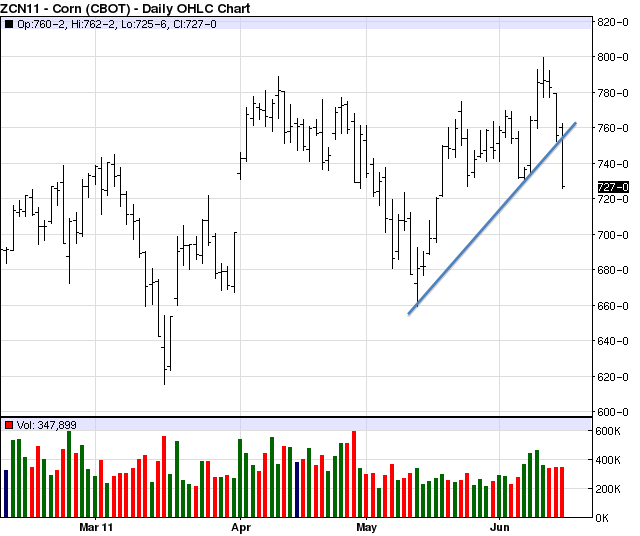
This morning it broke strong support at 7.34 and looks like it wants to fall off of a cliff. The same is true with wheat, oil and cotton. All of these are subject to worldwide demand and that demand appears to be fading. Now look at the behavior of gold:
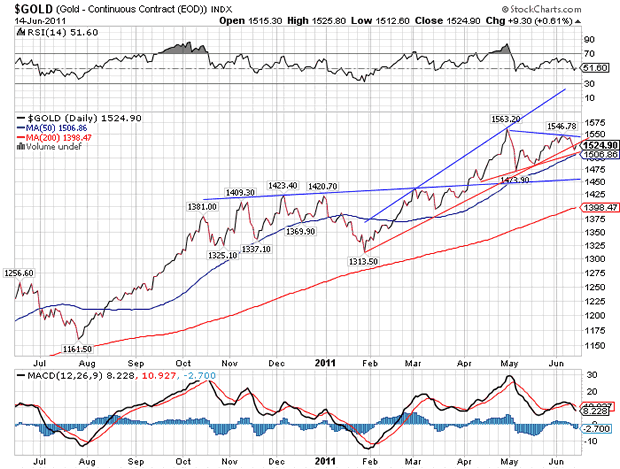
Gold has stubbed its toe of late and I have to wonder if it's because it is announcing the beginning of a major deflationary spiral. My best guess is that that's the case!
Now let's turn our attention to the US dollar. The dollar has been the world's whipping boy for a decade and it is now assumed that it must fall almost on a daily bases. I might add that is a dangerous mindset for any speculator to use. If I have learned anything in the markets, it's that nothing is written in stone. Also, when all the lemmings go one way, you had best go the other way. With that in mind let's take a look at this one-year daily chart for the US Dollar Index:
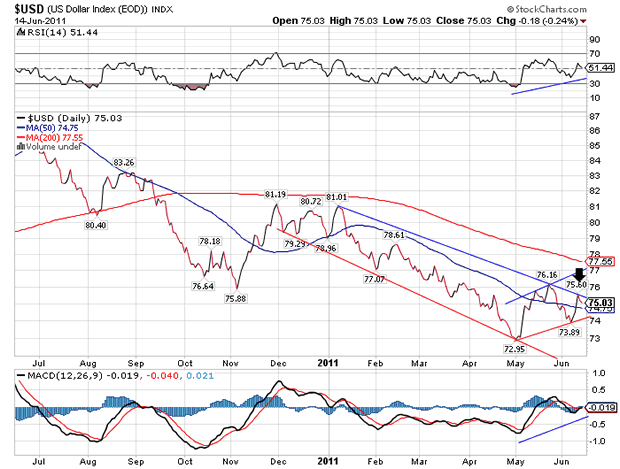
One possible way to look at this chart is to say that the dollar made a significant low in early May and recently made a higher low. Today the dollar is up 1.09 and that is a higher high and a break our above obvious resistance at 75.88. What would cause such a turn around? Simply put, deflation! Everyone is looking for inflation, or stagflation, so they are either short dollars or they borrowed dollars to speculate with Francs, Euros or whatever. Aside from that the world economy is slowing down and it is swimming in US dollar denominated debt. The dollar senses that and begins to rise and that puts a real squeeze on everyone since they all moved to one (wrong) side or the boat. I've also learned that markets are exceedingly ruthless and will always do what you can least afford when you can least afford it. I think there is a real chance that the dollar could move higher for one, three, or even six months, and the effect will be devastating.
All of this of course is taking place in a pre-QE3 world. If the Fed announces QE3 tomorrow then we'll go back to the way it was two months ago. Rising stocks, rising gold and rising commodities prices, but it won't last for long. Right now gold, commodities, stocks and the dollar are all acting as if QE3 will not come to pass, and that's all that matters. Now take a look at the daily chart of the S & P 500:
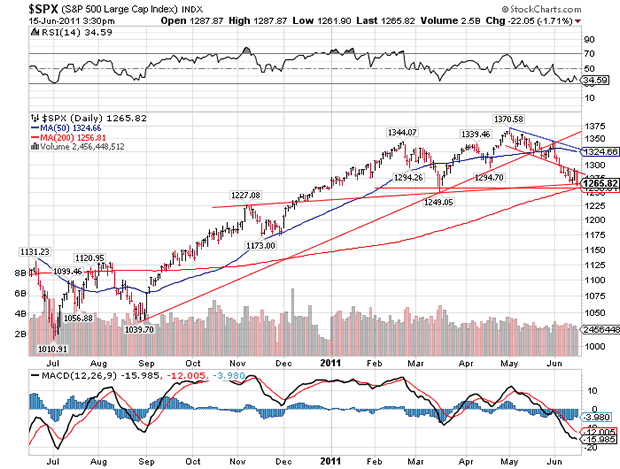
Yesterday we saw a double-digit rally on light volume and today we see a 21-point decline (so far) on heavier volume and that has been the pattern. Also, today's decline was a 92% down day and that is the third such event in three weeks. Today has produced a lower low (1,261.90) so yesterday was nothing more than a counter trend reaction up to good resistance at 1,286.00, and now the decline will continue until we see a test of the March closing low at 1,251.00. I believe that we'll see a close below the March closing low and a test of strong support at 1,233.00 before we see any kind of decent reaction. That reaction will be the key to the future.
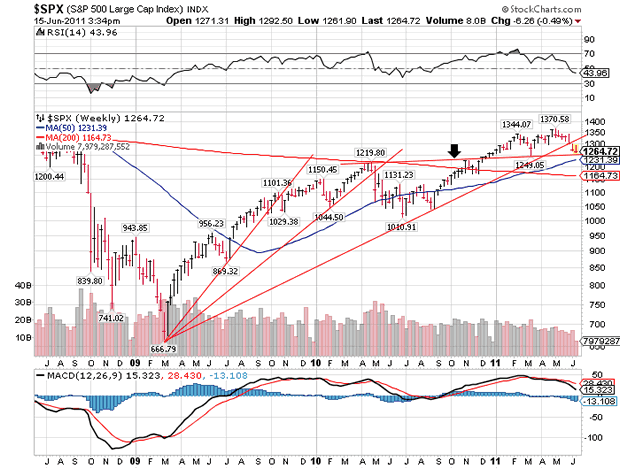
Now you are looking at a twelve-year chart of the S & P and it is telling quite a story assuming anyone is paying attention. You can see how the S & P continued to move sideways out of trading ranges until it finally seemed to exhaust its upward momentum and has turned down. You can see that I've drawn a slightly upward sloping line that connects two significant highs and that will support the market at 1,231.00. This correlates nicely with the 50-dma and the previously mentioned Fibonacci support at 1,233.50 and should provide a bounce. The shorter and weaker the bounce, the more trouble we're in! I would expect a reaction to last no more than twelve days and recover no more than 61% of the initial decline. Time will tell if I am right. Meanwhile the Fed needs to pay very close attention here because once deflation grabs hold no amount of printing will stop it. They fell asleep at the switch back in early 2007 when there were clear signs that real problems existed. Now the Fed is taking a "wait and see" attitude when it should be acting. The money spigot should be wide open and it's not.
We are at a crucial time right now. Everything is signaling deflation although gold and silver did manage gains today. What happens now will define what happens in the stock market over the next year and maybe even the next decade. The Fed can only print and yet QE1 And QE2 have proven that printing is no solution. The next round of quantitative easing, assuming there is one, will have a very short life span. Every one should know that by now and it only serve to kick the can a little further down the road. There are certain factions in Congress that want to force the issue and if they succeed in stopping further increases in the debt ceiling, we'll fall into an immediate a deep depression. None of this would even be an issue if Sir Alan Greenspan had simply left the markets to its own devices fifteen years ago, but he didn't and here we are. I actually hope the US defaults and reality sinks in. Maybe they'll kick all the bastards responsible for this out of Washington and we'll see a real government and a return to real values. We'll know soon enough.
Anthony J Stills Steve Betts
as@theablespeculator.com sb@theablespeculator.com
© 2011 Copyright Anthony J. Stills - All Rights Reserved
Disclaimer: The above is a matter of opinion provided for general information purposes only and is not intended as investment advice. Information and analysis above are derived from sources and utilising methods believed to be reliable, but we cannot accept responsibility for any losses you may incur as a result of this analysis. Individuals should consult with their personal financial advisors.
© 2005-2022 http://www.MarketOracle.co.uk - The Market Oracle is a FREE Daily Financial Markets Analysis & Forecasting online publication.


