Stock Projection Using Computer Aided Learning
Companies / Trading Systems Jun 17, 2011 - 01:13 PM GMTBy: Submissions
William (Bill) Licata writes: This article is an introduction into independent research I’ve conducted into stock price forecasting using computer learning algorithms and stock historical data available from several websites on the internet. The algorithms have been programmed into C language and runs under windows requiring only a couple of inputs (in its simplest application).
The software has been developed over approximately 6 years as time permitted and was written so the average investor or day trader could use it. I’m an algorithm developer by profession and write software for the purpose of testing new algorithms or applying existing algorithm to new applications. There are multiple ways of using the software, this article will show some test results and make some comments on the test results. The software is not for sale or is it associated with any subscription service ( not to preclude either from happening sometime in the future). Whether future articles are submitted will depend on the level of interest this article solicits. The author hopes visitors to the website will find the article of some interest.
Sample of Test Results
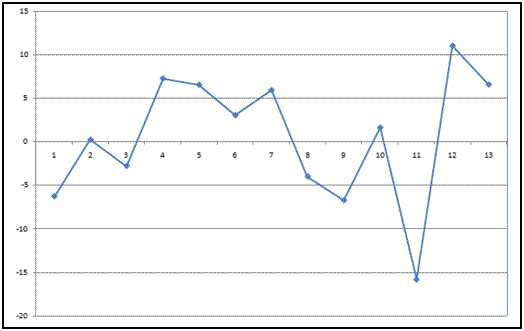
Figure 1 is a plot of the profit or loss trading a group of 5-stocks (AAPL, CMG, CREE, MA and NUE) over approximately a 2 week period. The stock NUE was added to the group as kind of a neutral stock (not in general one getting high level of media interest). If the profit and loss is added up over the days test, the net profit is approximately $7.00. That assumes trading 1-share on each of the 5-stocks based on a
Figure 1 Test Results 31 May to 16 June

1-day projection (open to close). During the 1st week of testing the software does better than the 2nd week. The 2nd week is the week stock options expire. Also notice the big spike the 2nd week (down and up) which I’d attribute to options being sold off. So I’d raise the hypothesis that there is a different trading pattern going on the week options expire. The software has no access into the number of outstanding options for the current option period. That information can be added but it not currently part of the software design. The amount of testing is small so the statistical accuracy is too low to draw solid conclusions. I do believe the software can be used to detect trading patterns an changes to patterns over time. Obviously, news is not a software input so news events can cause the software to give incorrect projections.
Software Projections for 17th June
I’m writing this article on Friday the 17th June. Table 1 shows the software projections for several stocks including the ones used to create Figure 1. The accuracy of the projections, the reader can decide for themselves after the market closes. Notice that the table includes 1-day and 5-day projections to point out that the software is not limited to 1-day projections. The confidence level is my approximate confidence level. The software does support back testing and computing a confidence level but the confidence I’d use in this Table is not yet computed in the software.
Table 1 Software Projections for 17 June 2011
Stock |
1-Day |
5-Day |
Confidence |
AAPL |
Buy |
Buy |
M |
AMZN |
Sell |
Buy |
M |
CMG |
Sell |
Buy |
M |
CREE |
Buy |
Sell |
L |
ISRG |
Sell |
Buy |
M |
MA |
Buy |
Sell |
L |
NTAP |
Buy |
Buy |
M |
NUE |
Sell |
Buy |
M |
SNDK |
Buy |
Buy |
M |
Summary
Since this the purpose of this article is to introduce this subject matter to readers of this website, I’ll keep the article relatively brief. I will point out that I would not trade just based on the information presented in this article. The software provides additional information not discussed in this article to protect my intellectual property. The software is also constantly in development since I am a researcher. The software may contain undetected errors.
By William (Bill) Licata, Ph.D.
Independent Algorithm Developer & Researcher
Bio
William Licata is a USA engineer who holds a Ph.D. in electrical engineering and has worked for 20+ years in the development of new products with an emphasis on algorithms and software development. He still work for private companies in the USA but does independent research in his spare time in the area of applications of computer learning to forecasting. He holds several patents, has published many papers and has taught short courses within the USA and internationally. Over the last 6 years, he has been studying stock technical analysis to support applying his research to that application.
© 2011 Copyright William Licata - All Rights Reserved
Disclaimer: The above is a matter of opinion provided for general information purposes only and is not intended as investment advice. Information and analysis above are derived from sources and utilising methods believed to be reliable, but we cannot accept responsibility for any losses you may incur as a result of this analysis. Individuals should consult with their personal financial advisors.
© 2005-2022 http://www.MarketOracle.co.uk - The Market Oracle is a FREE Daily Financial Markets Analysis & Forecasting online publication.


