


Mixed Signals About U.S. Employment Conditions
Economics / Employment Jul 07, 2011 - 02:31 AM GMTBy: Asha_Bangalore

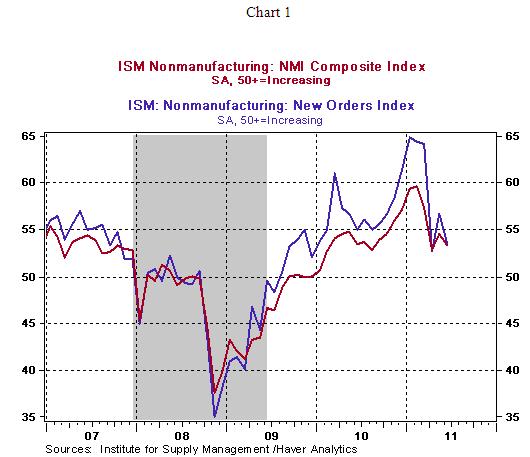
The non-manufacturing ISM survey indicates a slowing of activity, the composite index declined to 53.3 from 54.6 in May. Readings above 50.0 denote an expansion of activity while those below 50.0 indicate a contraction of activity. The index measuring new orders (53.6 vs. 56.8 in May) fell, while the index tracking employment held nearly steady (54.1 vs. 54.0 in May, see Chart 2). The employment index of the manufacturing survey shows an increase (59.9 vs. 58.2 in May)
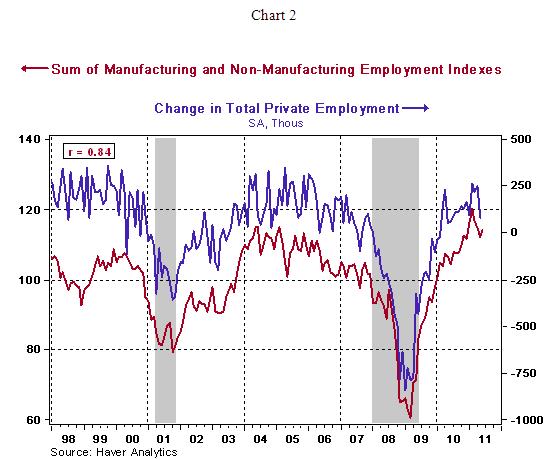
The sum of the employment indexes from the manufacturing and non-manufacturing sectors has a significant positive correlation with the change in private sector employment (see Chart 2). This sum of the two employment indexes moved up in June (114 vs. 112.2 in May), which suggests a larger increase in June private sector payrolls compared with a gain of 83,000 in May.
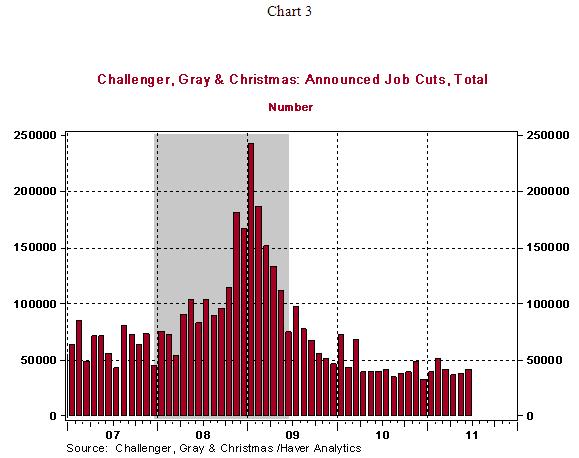
The 4-week moving average of initial jobless claims for the survey period of payroll employment moved down in June compared with the May reading (426,250 vs. 440,250 in May). However, the Challenger report in June shows an increase in layoffs (41,432 vs. 37,135 in May, see Chart 3). The elevated initial jobless claims readings and the mixed trends from layoff announcements, and employment indexes suggest another tepid monthly gain in payroll employment during June.
http://www.northerntrust.com
Asha Bangalore is Vice President and Economist at The Northern Trust Company, Chicago. Prior to joining the bank in 1994, she was Consultant to savings and loan institutions and commercial banks at Financial & Economic Strategies Corporation, Chicago.
Copyright © 2011 Asha Bangalore
The opinions expressed herein are those of the author and do not necessarily represent the views of The Northern Trust Company. The Northern Trust Company does not warrant the accuracy or completeness of information contained herein, such information is subject to change and is not intended to influence your investment decisions.
© 2005-2022 http://www.MarketOracle.co.uk - The Market Oracle is a FREE Daily Financial Markets Analysis & Forecasting online publication.