


The Macroeconomic Picture And The Stock Market, Massive Rally Wipes Out Losses
Stock-Markets / Stock Markets 2011 Jul 07, 2011 - 03:56 AM GMTBy: John_Hampson

 A massive stock market rally has wiped out a month's losses in a week, and is nicely represented by the below straight up move in % stocks above their 50MA from oversold to approaching overbought.
Source: The Big Picture / Thechartstore
Whilst Nymo and some other short term indicators are calling for a pullback, the majority of indicators that I follow still have room for more upside. Furthermore, the momentum and breadth (shown below) of the rally suggest the first pullback should be a buy.
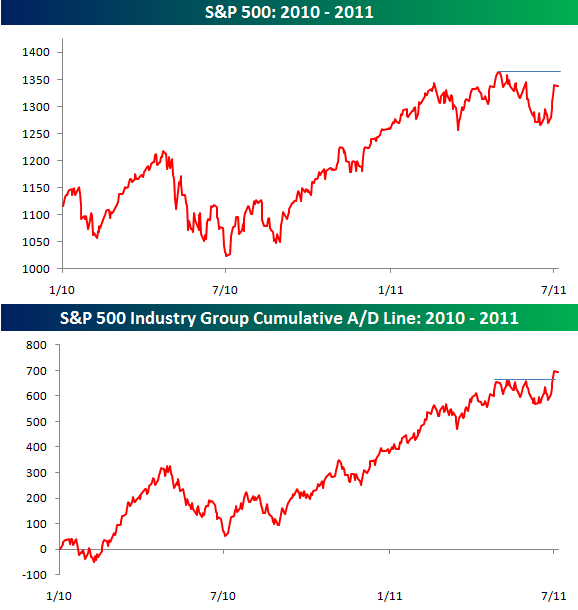
Source: Bespoke Investment
We are currently in a little window of positive seasonality that should give way to some downside into and around the full moon of July 15th. Here is the updated geomagnetism forecast which shows the possibility of some negative pressure into July 8th, but overall a fairly tame forecast for the next couple of weeks which should be supportive of the markets.
# 27-day Space Weather Outlook Table
# Issued 2011-07-05
#
# UTC Radio Flux Planetary Largest
# Date 10.7 cm A Index Kp Index
2011 Jul 06 82 5 2
2011 Jul 07 80 8 3
2011 Jul 08 80 10 3
2011 Jul 09 82 5 2
2011 Jul 10 84 5 2
2011 Jul 11 86 7 2
2011 Jul 12 88 7 2
2011 Jul 13 90 5 2
2011 Jul 14 90 5 2
2011 Jul 15 90 5 2
2011 Jul 16 90 5 2
2011 Jul 17 90 5 2
2011 Jul 18 88 5 2
2011 Jul 19 88 7 2
2011 Jul 20 88 8 3
2011 Jul 21 88 12 3
2011 Jul 22 86 15 3
2011 Jul 23 86 10 3
2011 Jul 24 86 7 2
2011 Jul 25 86 5 2
2011 Jul 26 86 5 2
2011 Jul 27 86 5 2
2011 Jul 28 86 5 2
2011 Jul 29 86 8 3
2011 Jul 30 85 8 3
2011 Jul 31 85 5 2
2011 Aug 1 85 5 2
Source: NOAA
There is a also a busy news calendar that should influence market movement, starting today with a forecast ECB rate rise, and US jobs data today and tomorrow. US earnings season begins again on Monday with Alcoa, and the general expectation is for robust earnings again, further emphasising the dichotomy between the corporate sector and the wider economy. We will probably have to wait until the following week (w/c 18th July) however to get enough key reports through to understand if earnings are likely to exceed or disappoint this time, and the market's response.
In summary, I believe the market may yet edge a little higher to more overbought, before pulling back into and around the full moon of July 15th (and I have begun to take some long profits for this). But I believe the momentum and breadth suggest we are going to ultimately reach for a new high (and I shall retain the bulk of long positions for this).
Looking at the bigger picture, the Bull Market Sustainability Index could not be more positive looking out upto 12 months.
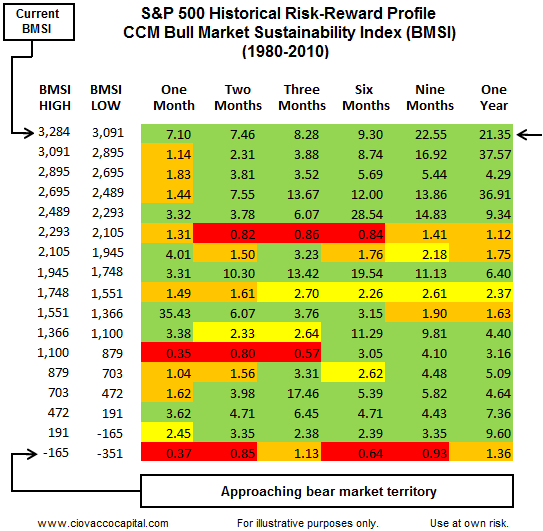
Source: Ciovaccocapital
The Citigroup Economic Surprise Index also suggests double digit equity returns over the next 12 months, based on history.
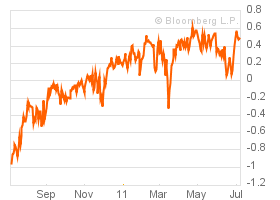
Source: Bloomberg / Citigroup / Coutts
Treasury yields, money supply and money velocity, and presidential cycle seasonality are all supportive of cyclical bull continuation currently, and the Boomberg Financial Conditions Index has jumped away from danger.
Source: Bloomberg Financial Conditions Index
In addition, by solar cycles we are in a historic period of growth and inflation, rising up to the solar maximum of 2013. There has been no recession in comparable periods for the last 80 years in the US.
So where are the current risks?
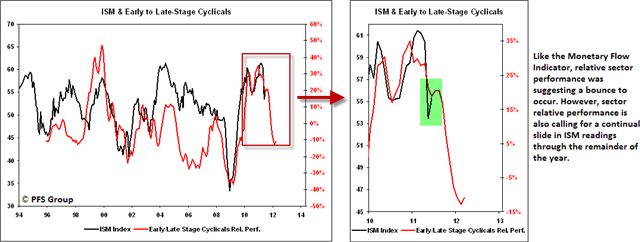
As previously noted, the Yield Curve is inverted in Brazil and close in India. Other countries are trending towards that situation, although many are some way off and we may yet see them change trend. Japan's economy appears to have bounced and we have seen similar bounces in manufacturing readings. However, Chris Puplava calls on relative sector performance history to suggest the bounce may be short lived.
Source: PFS Group
Global leading indicators remain positive but are trending down. Like the yield curves we could now go on to see a trend change, but as yet we do not. ECRI's latest reading for the US economy is shown below.
Source: Dshort / ECRI
Inflation remains a negative. Historically, 4% official inflation rates and associated overtightening have called an end to cyclical bull markets. US official inflation is around that level again and undoctored stats much higher. However, we are some way from overtightening interest rates, other than in developing countries.
Source: Shadowstats
In summary, the weight of evidence points to cyclical bull continuation, but there are some warning flags to keep an eye on. If we do not see improvement in these areas (leading indicators, manufacturing, yield curves) then I would expect a further stock market low in Q3 2011 (and I would likely expect that to be another buying opportunity, as the US Gov/Fed takes action again to shore up the economy in this critical stage of the presidential election cycle).
However, if on the other hand these indicators start to trend positive from here and economic surprises gain positive traction (in line with history, in line with forecasts of some of the main investment banks) then the stock market may not look back, and the June bottom would be the last great buying opportunity of 2011.
John Hampson
John Hampson, UK / Self-taught full-time trading at the global macro level / Future Studies
www.amalgamator.co.uk / Forecasting By Amalgamation.
© 2011 Copyright John Hampson - All Rights Reserved
Disclaimer: The above is a matter of opinion provided for general information purposes only and is not intended as investment advice. Information and analysis above are derived from sources and utilising methods believed to be reliable, but we cannot accept responsibility for any losses you may incur as a result of this analysis. Individuals should consult with their personal financial advisors.
© 2005-2022 http://www.MarketOracle.co.uk - The Market Oracle is a FREE Daily Financial Markets Analysis & Forecasting online publication.