


Has the 120-year Inflation Deflation Cycle Bottomed Early?
Economics / US Economy Jul 10, 2011 - 06:22 AM GMTBy: Clif_Droke

 In light of the impressive equities market rally from 2009 through 2011, some are wondering if perhaps the economic long wave has bottomed early. I recently received an email asking a question that is relevant to our discussion. He writes, "Suppose the big 120-year cycle hit a few years early, which for a cycle this long would certainly be possible. Perhaps the March 2009 low was the deflationary 120-year cycle low point, and the bull market just carries on for several more years. Is this possible?"
Before we can answer this, a discussion of the mechanics of deflation is in order. Deflation can be defined as a decrease in either the availability or the velocity of money and is characterized by, among other things, falling "core" prices. Certainly we've seen this to a degree in the years since we entered the final years of the 120-year cycle. Yet many commodity prices, including oil and food prices, haven't shown signs of being under the sway of deflation except during the credit crash period of 2008.
While some analysts may take this as a reason for believing that inflation, not deflation, is the economy's bigger concern, investors would do well to consider a few points. One of them is that oil and other key commodities are more easily subject to the influence of monetary manipulation, i.e. "quantitative easing" and the prices of these commodities can therefore be skewed against the prevailing deflationary current. Another point to consider is that the influence of the multi-billion-dollar hedge fund industry, which specializes in both creating and chasing momentum in futures markets, can create what appears to be inflation but actually is nothing more than an artificially induced temporary trend. The events of 2008 showed just how easily that such artificially inflated commodity prices can be deflated by the forces of Kress cycle deflation.
Deflation is more than just a monetary phenomenon, however. Long-term deflation is also determined by demographic trends. When a nation's population is in decline - either in terms of actual numbers or on a rate of change basis - its spending patterns change. Thus long-term deflation is a supply as well as a demand issue.
The U.S. will see the effects of this demographic change in the coming years as more and more Baby Boomers retire and eventually shift the ratio of workers to retirees in favor of the latter. This major demographic shift has the potential to threaten a number of federal social programs and possibly even the current U.S. standard of living. The demographic shift also partly explains the force behind the 120-year long-term cycle. Since this demographic shift shows no sign of reversing anytime in the immediate future, we have one reason for assuming the 120-year cycle has bottomed "early" and turned up anew.
It also helps to understand that within the 120-year cycle of inflation/deflation, there are two 60-year cycles. The current 60-year cycle began in 1954 and will bottom next in 2004. The final 10% of a cycle's duration is the "hard down" or hyper deflationary phase. This means the period between 2008 and 2014 is the hyper deflationary phase of the current 60-year cycle. Hyper deflation, also known as "winter" season in the terminology of the Kondratieff Wave, began in 2008 with the onset of the debt crisis. The deflationary winter season has been somewhat mitigated by the monetary stimulus of 2009-2011 as well as the peaking of the 6-year cycle scheduled for later this year. The onset of the final three years of the deflationary cycle in 2012, 2013 and 2014 will bring the worst part of the deflationary "winter" phase to the U.S. and likely also the global financial market.
As we've already seen, the onset of "winter" began with the debt crisis of 2008. That crisis wasn't actually resolved but merely postponed. Had the debt/credit crisis of 2007-2008 been allowed to run its course without government and central bank intervention, it's very likely that the 120-year cycle of inflation/deflation would have been fulfilled at least from a financial market standpoint and we therefore would have seen an early bottom (for all intents and purposes) of the 120-year cycle. This wasn't the case, however, and instead of allowing debt to unwind the government actually increased the nation's debt load. Here we have the biggest argument against an early bottom to the 120-year cycle. Until we see a significant trend established in the way of debt retirement, both on the public and a private level, we have no firm basis for assuming an early bottom of the 120-year cycle.
The following chart found in the July 1 issue of The Long Wave Dynamics Letter is worth a thousand words. It shows the gross domestic product of the U.S. contrasted against federal debt levels going back to 1940. As you can see, federal debt (red line) has actually exceeded real GDP (blue line) in the last couple of years since the credit crisis began. This is not how the debt-to-GDP ratio should look if we were in a new 120-year up cycle. If anything this chart strongly suggests the 120-year cycle hasn't bottomed yet, nor has it inflicted its worst damage. The 2008 credit crisis was likely only the proverbial "shot across the bow" warning of even worse things to come before the cycle bottoms in late 2014.
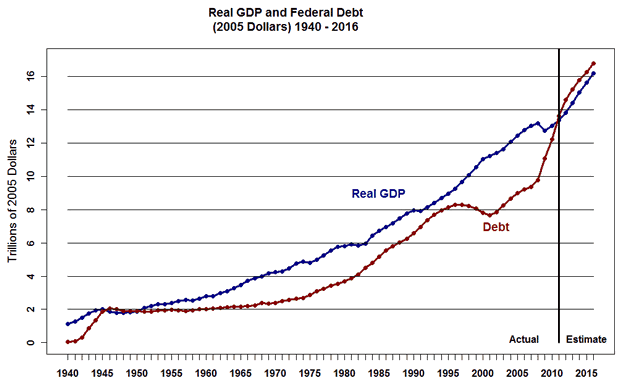
As David Knox Barer, editor of the LWD Letter put it, "The deleveraging of the U.S. and the world will be economically painful. A modern day Jubilee of debt reduction and cancellation through bankruptcy" will tell us the 120-year cycle is nearing its completion. We haven't seen this yet....
Consider also Washington's latest response to the contentious issue of the federal debt ceiling. Instead of moving toward a sensible policy of diminished debt through spending cuts, policymakers are instead arguing in favor of raising the debt ceiling so as to add even more debt. The A.P. reported the following on Friday, "The President cited the gloomy jobs report as one more reason lawmakers must strike a deal soon to raise the U.S. debt limit, saying the impasse was fueling uncertainty within financial markets and in the business sector." Much could be said in the way of analyzing his statement, particularly the homage that all recent presidents have paid to Wall Street. Suffice it to say the U.S. has a ways to go before the 120-year cycle has completed its course.
The Fed's monetary stimulus efforts of the last two years have done nothing to help what is arguably the biggest symptom of long-term deflation, namely the housing market. It's important to recall that the winter season of the deflationary cycle began with a collapse of real estate prices. The real estate bear market has been the chief evidence of deflation in the U.S. for the housing market prior to the crash represented the biggest form of savings for most Americans. Real estate is an excellent asset to own during the inflationary phase of the long-term cycle of inflation/deflation but it's one of the worst assets to own during hyper deflation. As an illiquid asset, housing prices tend to depreciate in the final years of the deflationary winter season, as many have discovered. Here is yet another proof that the deflationary cycle hasn't yet bottomed; until real estate bottoms we can only assume the 120-year cycle still hasn't bottomed.
The 120-year long wave cycle of inflation/deflation is driven by many factors, only some of which we can comprehend. (There is arguably something of a cosmological element in this cycle which is beyond our understanding, but that I leave for the abstract theorists to explain). Important for our discussion is that the 120-year cycle, in its deflationary aspects, is driven by demographic trends, which in turn influences basic economic demand. The life cycle of a large nation such as the U.S. is characterized by vigorous growth in the first half of the cycle; this in turn is inflationary since both production and spending are in the peak years. When the population begins to age at some point during the long-term cycle it is accompanied by diminished spending and lower domestic productivity. This explains America's move from a primarily industrial nation to a service economy, and finally, to its current status as a predominantly financial economy.
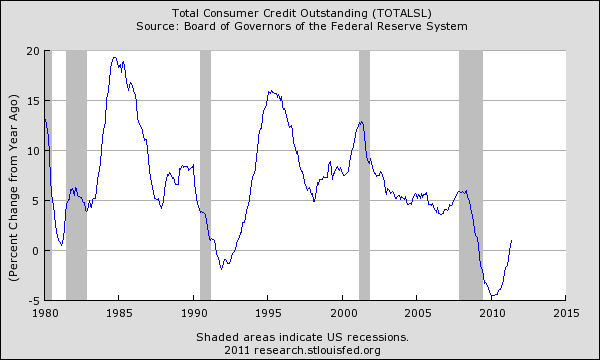
A vigorously expanding population also tends to contract large amounts of debt during its prime earning years. Then, as the nation heads toward retirement, it tends to collectively expunge this debt. One of the biggest indicators for proving the existence of long-term deflation is the chart showing consumer installment credit. As you can see here, the trend has been toward declining debt among U.S. consumers over the last several years. Notice, too, that the peak in consumer credit outstanding coincided exactly with the peak of the 60-year cycle in late 1984.
The U.S. government, unfortunately, hasn't yet learned its lesson regarding the contraction of debt - a lesson which the average taxpaying American has already learned. Until it does we can only assume the 120-year cycle must complete its vicious work of debt reduction before we bid it adieu.
Gold
Many investors have asked, "If deflation is the main problem facing the economy, why should I own gold?" Gold, they reason, is an inflationary hedge and if that be so, how can it possibly benefit from deflation?
Gold is more than an inflationary hedge, however. As Samuel Kress has shown in his cycle work, gold benefits from both extremes of the 60-year cycle, namely hyper inflation and hyper deflation. During the inflationary period of the current 60-year cycle in the 1970s, gold benefited from the extreme inflation as the cycle was peaking. In more recent times gold has benefited from deflation while the cycle is declining. Consequently, investors look to the precious metal for financial safety in times of uncertainty.
Gold has in fact become the new long-term investment vehicle of choice for retail investors. Traditional forms of savings such as real estate have become depreciating assets and no longer offer protection against the ravages of the long-term cycle. Meanwhile savers are punished with extremely low interest rates while the value of the currency diminishes through central bank money printing schemes. It's no wonder then that investors are turning to the yellow metal as the safe haven du jour during the "winter" season of the 60-year/120-year cycle.
Economic Outlook
We've been discussing matters pertaining to the longer-term economic outlook. The short-term outlook is a different story, however. The residual momentum which has built up courtesy of the Fed's "quantitative easing" (QE2) program coupled with the peaking 6-year cycle is still an important variable.
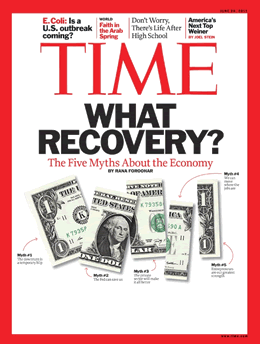
Speculation abounds as to whether or not the U.S. economy will show any additional signs of recovery this summer. Opinion seems to be titled in favor of the bearish outlook on the economy for the balance of 2011. An example of this is found on a recent front cover of Time magazine ("What Recovery?)
If anything, this magazine cover may have some short-term contrarian significance and it's possible we could even see a mini-economic upturn in the coming months and into the 6-year cycle peak window this fall. But how can we know whether any economic improvement is forthcoming? The closest thing I've been able to find that provides a reliable leading signal on the near term direction of the retail economy is the New Economy Index, or NEI for short. This index is simply an average of the weekly closing stock prices of five of the most economically sensitive stocks that also represent the main segments of the retail economy. The components are: Wal-Mart, Fed-Ex, Monster Worldwide, Ebay and Amazon.
I've kept the NEI since 2007 and have been pleased with its performance for the most part. It has often provided a "heads up" on a significant change in the intermediate-term (6-9 month) trend in the retail economy; at its worst it is a coincident economic indicator but far ahead of the various economic indices published by the government in terms of showing real-time changes in the economic trend. Here's what the NEI looks like as of Friday, July 8, when it was last updated.
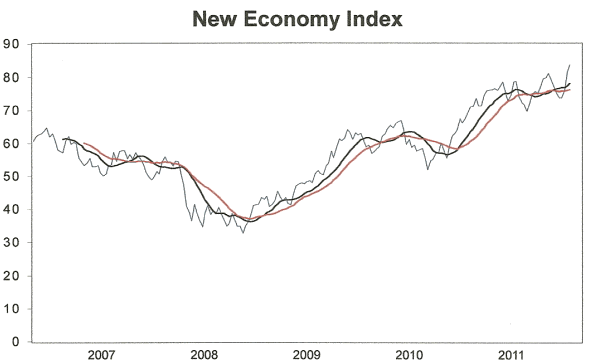
The rules for interpreting the NEI are simple. As long as the index is in an upward trend the U.S. economy should be considered to be on a fairly sound footing in the short-to-intermediate term. Only when a reversal is signaled should we be concerned that the retail economy will weaken. A reversal occurs either when the NEI breaks below its nearest pivotal low or when the 12-week moving average (black line) crosses under the 20-week moving average (red line). Neither of these things have happened yet; indeed, the moving averages have recently turned up with the index itself making new multi-year highs as of July 8.
As long as the intermediate-term uptrend for the NEI remains intact there's no need to worry about the economy's prospects in the weeks and months ahead. The economy looks to have obtained a reprieve of sorts, at least for a while longer. Only if a reversal is signaled in the NEI will we join the mainstream media in worrying about the near term economic outlook.
How to Trade the Most Profitable Chart Pattern
One of the most profitable chart patterns is also one that receives virtually no recognition from market technicians. The pattern I'm referring to is the "channel buster," which can be either a bullish or a bearish pattern depending on how it manifests in the charts of actively traded stocks and commodities. This highly profitable pattern was aptly named by stock market veteran Don Worden, editor of Worden's Weekly Reports. As its name implies, the channel buster involves a price breakout (or breakdown) either above or below the outer extremity of a trading channel.
The channel buster can be highly profitable if you know how to spot it. It's a chart pattern that is commonly seen in bull markets and bear markets alike and is the ultimate "all weather" money maker for short-term oriented traders. In my book, "Channel Buster" How to Trade the Most Profitable Chart Pattern," I explain the mechanics of this amazing chart pattern and how you can spot it an almost any actively traded stock or commodity. The book also provides rules for entering and exiting a trade based on the channel buster method. This is the only book available that deals exclusively with the channel buster. The channel buster is a breakthrough in the trend analysis of stocks and commodities.
The book was written so that retail traders might be able to understand and practically apply these useful methods of market analysis. The book is now available for sale at: http://www.clifdroke.com/books/channelbuster.mgi
Order today to receive your autographed copy and a FREE 1-month trial subscription to the Momentum Strategies Report newsletter.
By Clif Droke
www.clifdroke.com
Clif Droke is the editor of the daily Gold & Silver Stock Report. Published daily since 2002, the report provides forecasts and analysis of the leading gold, silver, uranium and energy stocks from a short-term technical standpoint. He is also the author of numerous books, including 'How to Read Chart Patterns for Greater Profits.' For more information visit www.clifdroke.com
Clif Droke Archive |
© 2005-2022 http://www.MarketOracle.co.uk - The Market Oracle is a FREE Daily Financial Markets Analysis & Forecasting online publication.