Stock Markets Trapped in a Contracting Fibonacci Spiral Towards Point of Singularity 2019
Stock-Markets / Stock Markets 2011 Jul 14, 2011 - 01:40 AM GMTBy: David_Petch

 Today's article focuses on an “Aha moment”, while drinking a bottle of home made Port with a visiting friend . Fibonacci sequences were discovered by Fibonacci around 1200 AD...it is only recently that Fibonacci ratios, such as the golden ratio (1.618) were found to exist within the framework of the Universe and evolution of life. Robert Prechter has written volumes of extraordinary articles and books dealing with Fibonacci numbers etc. So I will assume that most readers are familiar with concepts. The Fibonacci sequence is 1, 1, 2, 3, 5, 8, 13, 21, 33, 55, 89 etc. Which is based upon no, ni+no.... nj..
Ratios that are derived from the Fibonacci sequence are 0.382, 0.5, 0.618, 1, 1.382, 1.5, 1.618 etc. These ratios play a significant role in market dynamics, particularly in the field of Elliott Wave. Glenn Neely, the founder of NeoWave, which is a major advancement of the original Elliott Wave Principle produced a book titled “Mastering Elliott Wave”. Anyone who is serious about Elliott Wave should read his book. There are numerous advances Neely has made since this landmark text, so going to www.neowave.com and reading "Questions of the Week" can quickly bring one up to speed.
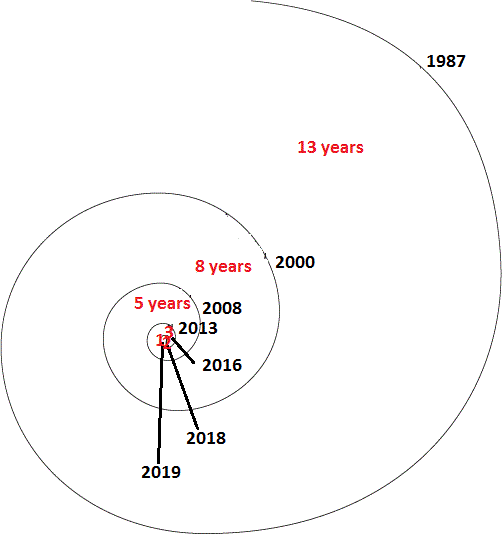
Fibonacci sequences are generally seen as an expansionary trend, but what about if they were to occur in reverse to a point of singularity. I borrow the term “Singularity" from Einsteins field equations which defines it as a point where matter is forced to a single point, as in the centre of a black hole. Figure 1 depicts a Fibonacci spiral, with the reverse signature and noted future dates.
Figure 1

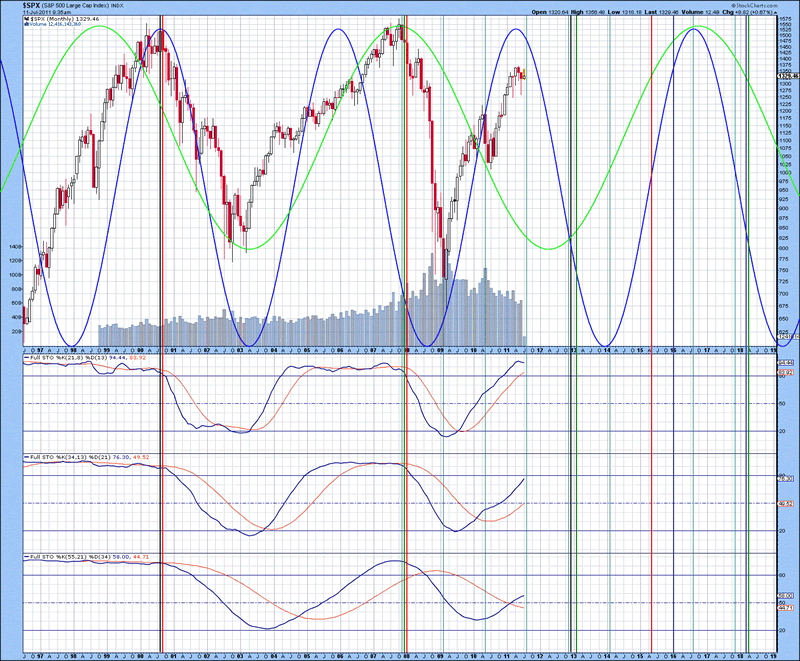
Major crashes such as 1987 lose perspective of percentage losses when examining the “Forest” logarithmic picture of the stock market. Figure 1 below illustrates the S&P 500 index from 1996 until present, as well as a window into the future. Oscillators are included to show the 2000-2002 bottom (blue) and the rise from 2001 till 2008 (green). Coloured bars depict the 1, 2, 3, 5, 8 and 13 year cycles. As indicated for the past 1 1/2 years, a top in the broad stock market indices is not expected until early 2013, as suggested by full stochastics below.
Figure 2

When people wake up on December 22nd, 2012 and realize the Sun was not sucked into a black hole and the birds are still chirping, a “relief rally” is likely to last into February/March 2013. At this point in time, the USD is likely to have based between 65-67 and will be set to rise sharply. A top in 2013 will represent a period of deflation lasting for at least 20-24 months, which will see the US 10 Year US Treasury Index in wave (2). All of this analysis was published last week for review.
While I was thinking this past weekend about 2013, it dawned upon me that if this came to fruition, then market tops from 1987 until present were following a reverse Fibonacci spiral. The majority of Martin Armstrong's modelling is based upon Fibonacci sequences...human behaviour is predictable and follows a set pattern that tends to go to completion. So, if the broad market indices are caught up in a Fibonacci spiral with a point of singularity between now and 2019, how will this unfold?
The S&P 500 index is likely going to complete the wave (XX).[B] correction in early 2012, with wave (Z).[B] to follow and complete in early 2013. During this period of time, the 10 Year US Treasury Index is set to rise to near 5.2-5.4% to complete wave (1). This will mark a top in commodities as well as broad stock market indices that should see a sharp decline through 2014. This period of time will be extremely hard on most, as commodity prices will have consumed all disposable income, making cash a precious commodity. A deflationary decline will see asset prices fall...rising asset prices are the basis of sustaining pension funds so this will pose a huge problem. The price of gold and silver will likely decline during this time frame as cash becomes king.
From early 2015 until 2016, there will be a bounce higher in broad stock market indices, but as the model of the Fibonacci spiral indicates, volatility will become greater and greater per unit time until the point of singularity is reached sometime in 2018-2019. During this period of time however, gold and silver bullion are likely to go to levels only dreamed of before. Beyond 2014, when gold and silver rise to above $3000/ounce and $100/ounce, respectively, expect countries such as Mexico and South American countries to impose cut off limits to gold and silver prices. For example, if gold goes to $6000/ounce, a country might state that any rise in price above $2000/ounce is money that goes to the government. Canada is likely to be the safe haven for gold and silver companies until near the end of the crisis in 2018-2019. When this point in time is reached, it will be time to quietly sell all positions and hold cash and other assets.
Other asset classes besides commodity stocks are likely to remain flat during the coming 7-8 years due to rising interest rates and decreased available discretionary household income due to rising costs, including transportation costs due to Peak Oil.
The period of time to act is now, because money made from rising gold and silver bullion and their related stocks lies directly ahead into 2012/early 2013. Money made from this will help between the time frame of 2013 and late 2014 when prices of many stocks become significantly cheaper. The S&P is likely to oscillate between 800-1400 over the next 7-8 years, which by 2019 will see many pension funds wiped out due to excessive draw. Those with private pension funds could see those assets seized in nationalization attempts to create stability (short-term stability). So, the safest thing to do is own gold and silver bullion and have precious metal stocks in trading accounts or tax-free savings accounts.
Analysis from last week fits with the above line of thought for this article, with respect to how market behaviour is likely to pan out over the course of the next 7-8 years.
By David Petch
http://www.treasurechests.info
I generally try to write at least one editorial per week, although typically not as long as this one. At www.treasurechests.info , once per week (with updates if required), I track the Amex Gold BUGS Index, AMEX Oil Index, US Dollar Index, 10 Year US Treasury Index and the S&P 500 Index using various forms of technical analysis, including Elliott Wave. Captain Hook the site proprietor writes 2-3 articles per week on the “big picture” by tying in recent market action with numerous index ratios, money supply, COT positions etc. We also cover some 60 plus stocks in the precious metals, energy and base metals categories (with a focus on stocks around our provinces).
With the above being just one example of how we go about identifying value for investors, if this is the kind of analysis you are looking for we invite you to visit our site and discover more about how our service can further aid in achieving your financial goals. In this regard, whether it's top down macro-analysis designed to assist in opinion shaping and investment policy, or analysis on specific opportunities in the precious metals and energy sectors believed to possess exceptional value, like mindedly at Treasure Chests we in turn strive to provide the best value possible. So again, pay us a visit and discover why a small investment on your part could pay you handsome rewards in the not too distant future.
And of course if you have any questions, comments, or criticisms regarding the above, please feel free to drop us a line . We very much enjoy hearing from you on these items.
Disclaimer: The above is a matter of opinion and is not intended as investment advice. Information and analysis above are derived from sources and utilizing methods believed reliable, but we cannot accept responsibility for any trading losses you may incur as a result of this analysis. Comments within the text should not be construed as specific recommendations to buy or sell securities. Individuals should consult with their broker and personal financial advisors before engaging in any trading activities as we are not registered brokers or advisors. Certain statements included herein may constitute "forward-looking statements" with the meaning of certain securities legislative measures. Such forward-looking statements involve known and unknown risks, uncertainties and other factors that may cause the actual results, performance or achievements of the above mentioned companies, and / or industry results, to be materially different from any future results, performance or achievements expressed or implied by such forward-looking statements. Do your own due diligence.
Copyright © 2011 treasurechests.info Inc. All rights reserved.
Unless otherwise indicated, all materials on these pages are copyrighted by treasurechests.info Inc. No part of these pages, either text or image may be used for any purpose other than personal use. Therefore, reproduction, modification, storage in a retrieval system or retransmission, in any form or by any means, electronic, mechanical or otherwise, for reasons other than personal use, is strictly prohibited without prior written permission.
David Petch Archive |
© 2005-2022 http://www.MarketOracle.co.uk - The Market Oracle is a FREE Daily Financial Markets Analysis & Forecasting online publication.


