


Stock Market Bulls Scrape Through Nasty Week
Stock-Markets / Stock Markets 2011 Jul 17, 2011 - 05:45 AM GMT

 It''s been a nasty week the past week in the markets, and at one time in the European globex session, there was a potential panic situation when the DAX went into free fall until it hit support at 7000, likewise the FTSE stopped at 5800, the bears really got their claws dug in, but a bad situation got averted, (I don''t know how long it will hold through) but so far so good, the bulls have just scrapped through and my idea of seeing a new yearly high on stocks is still on target as key support areas held, even with that mini panic we saw in the week on European markets.
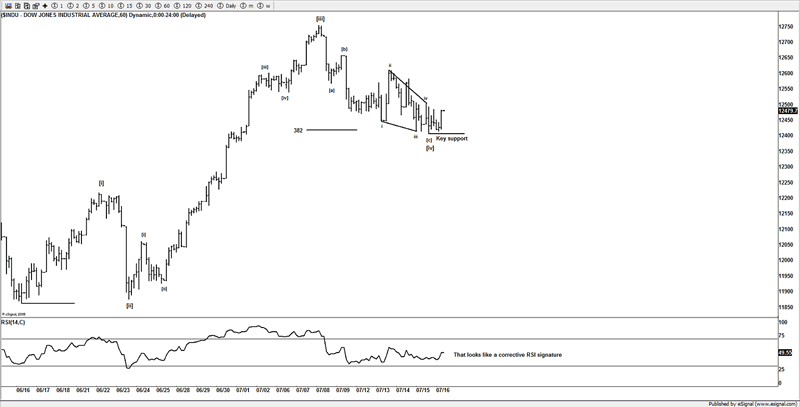
DOW
Following on from last week''s idea of a 4th wave pullback, so far it''s looking good, and Friday may of put that 4th wave low in. We do have 2 alternative ideas that we also monitoring but they will come into play should the US markets loose the lows made on Friday, or a rejection of our key resistance #s.
The DOW has pulled back to a 38.2% of the 3rd wave which is a normal correction for a 4th wave pullback, if you look at the RSI, that atm has a signature of a correction and is one of the reasons I like this setup, but the bulls need to deliver next week and get back above key resistance areas, or we are seeing lower prices, we have some areas above that will need talking out on the upside, if the bulls can deliver and force the market above those areas, then the new idea of new yearly highs looks more promising, so whilst I am still bullish these markets, failure to get above our key #s above will have us selling this market once more and look lower and switch to one of our alternative ideas.
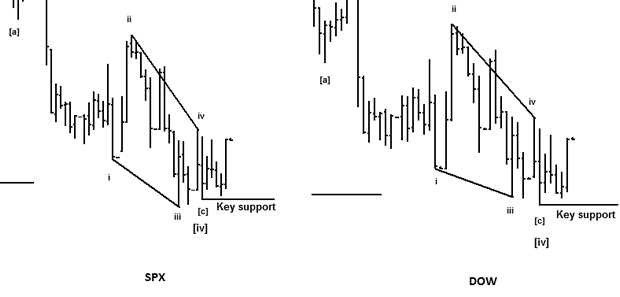
Working the same idea on the SPX, had us looking for a brief new low to end the ED idea for wave [c], however if you look carefully the DOW had made that new low and it appears that the SPX truncated, hence one of the reasons I think this now makes sense if the bulls can rally this market hard from early next week, the risk is to the lows made on Friday, so as long as they hold we are going to give this idea a chance, failure to get above our resistance areas above, or lose this key support area, will see the markets head lower.
One such long term count, still requires a move to see that new yearly high, and whilst I would respect any aggressive move under key support, so far the bears have failed to push the market under those supports areas, which when I look at the evidence from other markets still suggests seeing new yearly highs. If the bears can show me some evidence to support a reversal, then I am more than happy to listen and take note, but whilst I am not calling for some sort of super bull market from here, I am still thinking we can see that new yearly high and finish this potential pattern.
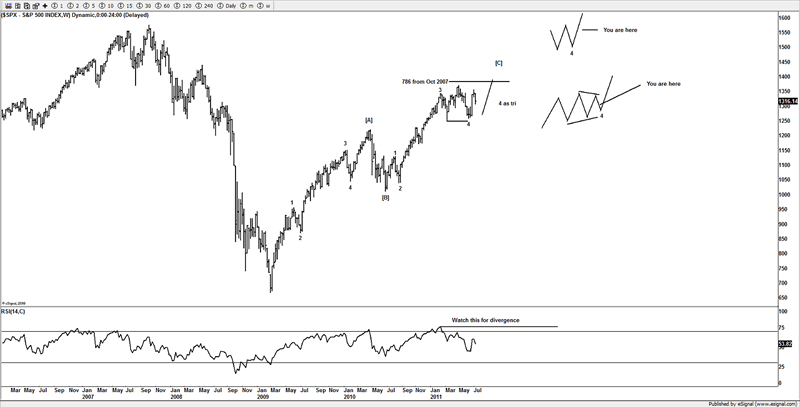
SPX Analogue
I noticed this analogue, and it would work well with a new high for point 3. The peak in the RSI has most likely been put in place and I suspect like back in the last bull run from Oct 2002, if we did see price towards 1380-1400SPX we should see a lower low in the RSI.
The RSI was a key signature on the topping phase in 2007, if readers remember the "China crash" the RSI was telling of a move lower setting up, just as it was being suggested on the July and Oct peaks in 2007.
The daily RSI is trying to decide if it wants to continue with the bull trend or push into a bear trend, whilst I see the obvious H&S on the markets, and I will respect any violation of lower support, until such an occasion arises, if the market still are suggesting higher, then that''s the idea going forward.
As the saying goes "If it ain''t broke don''t fix it"

AMZN
I have been tracking a number of heavy weight tech stocks and one of them is AMZN, as I fail to see how you can remain bearish on the markets when the big cap stocks are pushing higher, it''s one of the reasons I remained and still am bullish and looking for those new yearly highs.
Looking at this stock, it looks like it''s in a 4th wave and ready to rally higher, I don''t see enough evidence yet to support an alternative bearish view, if this and stocks like AAPL are heading higher, then it is likely to see the NDX climb higher, as they carry a decent weighting to the NDX. This stock is holding up well, and from here I think it''s good a very good chance of seeing that new yearly high around $220. Until price gives me a reason to be concerned, and to negate the bullish view on the markets, I still think we have good grounds to see those new yearly highs.
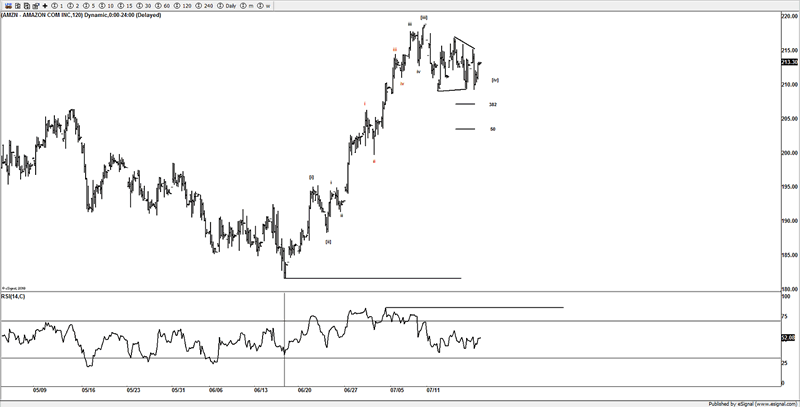
So if we were to see that new high for a 5th wave, it might be a good idea to look at puts, as if we see the NDX follow higher, and put in that new high in alignment for a 5th wave, then you have potentially a great setup that could be reversing, once 5 waves are in, a target from here is around the $220 area, but subject to structure and I also suggest watching what the NDX does.
Of course if this stock and the main markets like the NDX were to sell off and push lower, then this idea will be void, but atm, I see nothing to suggest reversing my bias (which is still bullish) just yet, if I see such price action, then I and members will be quick to jump on the trend should the US markets start to sell off heavily, but in order for that to happen, I need to see some evidence 1st.
Unfortunately I won''t be able to follow up AMZN in these pages, only members will be able to keep on top of this stock and the other markets that we follow, that are presented in these articles; however I wanted to present some evidence why I still remain bullish on the US stock markets. It''s not because I am perma-bull as some would think, it''s that I follow price in a specific manor, I let price do the talking and I respect what my work tells me, sometimes that goes against what the majority of traders would like to believe, I have gone against the majority of traders before and will gladly do so again, as long as I and members are on the right side of the trends that is all that matters to me, be it bull or bear.
I look at some of the big tech stocks like AMZN and AAPL and they continue to drive higher, as long as that continues, its unlikely that the markets are heading into some sort of crash, as some would have you believe is around the corner.
The bottom line is that until price actually confirms a bearish idea and lower supports areas are violated the market is still firm and appears to still want those new yearly highs, and whilst my ideas are valid I will respect that.
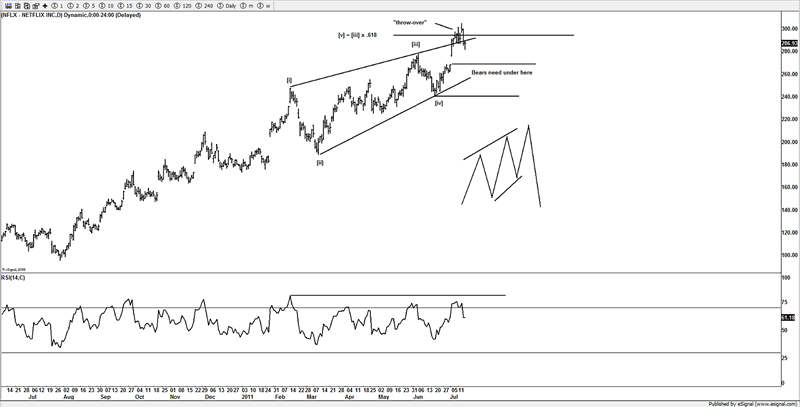
NFLX
I am not a stocks technician by trade, as I find that too confusing with all the news from earnings etc, but some of the bigger cap stocks do at times count well, and one such stock I have been following is NFLX, mainly because it reminds me of the Nasdaq bubble years.
Now I could not tell you anything about this stock other than I think it rents DVDs or something like that, I don''t know anything about earnings or anything to do with finances; I just follow price and patterns.
Hence the pattern that is being suggested here is a great looking ending diagonal (ED) that''s what comes at the end of a trend, so if NFLX has topped or about to top from here, then it sure looks a great pattern to top out on.
Again, I have no clue about this company or even who is the CEO of the company, stocks are not something I have much dealing in, I follow them as part of my work with the broader markets, but occasionally they present some great looking patterns such as this ED.
Like AMZN, it''s unlikely I will follow up this market in these pages; any updates will be kept in house for members.
With 5 waves up to complete what looks like a text book ED, and what can be classified as a "throw-over" the next move needs to be a sell off that gets price under $260 area. So I suggest waiting a little while 1st to see if more evidence of a reversal is seen.
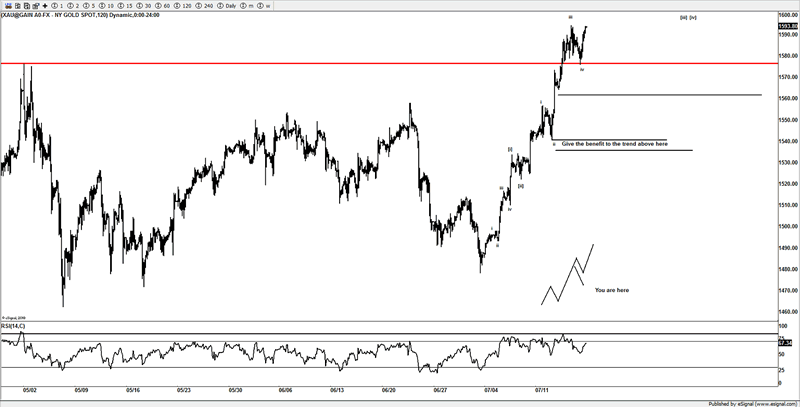
Gold
It seems the only real time this market gets some attention is when its making new highs, currently this run does not look complete and I suspect a few more gyrations are needed 1st, so could head as high as $1620 on this initial move before some sort of reversal is seen to corrective this move.
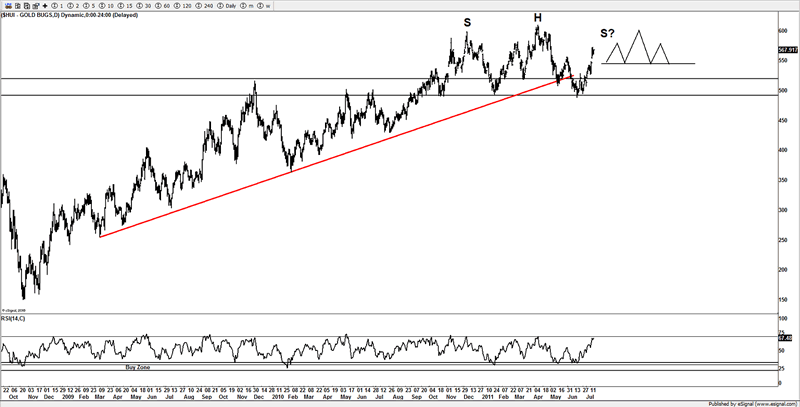
HUI
With gold''s move to new all time highs the $HUI has followed, but now at an inflection point where we find out now if this is a head and shoulders topping pattern, or going to run up and potentially see new yearly highs.
I wrote about the $HUI is a few issues back after seeing a 5 waves decline, I felt that a bounce was setting up, well here is that bounce, and now we find out who is going to be in control.
Conclusion
The bears got their claws into the markets mid last week and almost got the ball rolling, however the markets have remained firm and managed to shake off that mini crash in the European markets.
There is a potential setup on the US markets that suggest a low is in place, but that bulls need to deliver on that promise early next week or face losing that advantage and seeing prices lower from here.
The bulls have stemmed the selling temporary, but need to deliver on the upside to force the shorts to cover, as potentially they do risk a substantial move lower. It should be a good week next week with the way some markets are setting up.
Unfortunately there is only so much space and time to devote to these pages, I have only scraped the surface with the message the market is saying. There are some great looking patterns in many of the FX crosses and commodities; it''s looking good over the coming months to setup some terrific trades.
Until next time.
Have a profitable week ahead.
Click here to become a member
You can also follow us on twitter
What do we offer?
Short and long term analysis on US and European markets, various major FX pairs, commodities from Gold and silver to markets like natural gas.
Daily analysis on where I think the market is going with key support and resistance areas, we move and adjust as the market adjusts.
A chat room where members can discuss ideas with me or other members.
Members get to know who is moving the markets in the S&P pits*
*I have permission to post comments from the audio I hear from the S&P pits.
If you looking for quality analysis from someone that actually looks at multiple charts and works hard at providing members information to stay on the right side of the trends and making $$$, why not give the site a trial.
If any of the readers want to see this article in a PDF format.
Please send an e-mail to Enquires@wavepatterntraders.com
Please put in the header PDF, or make it known that you want to be added to the mailing list for any future articles.
Or if you have any questions about becoming a member, please use the email address above.
If you like what you see, or want to see more of my work, then please sign up for the 4 week trial.
This article is just a small portion of the markets I follow.
I cover many markets, from FX to US equities, right the way through to commodities.
If I have the data I am more than willing to offer requests to members.
Currently new members can sign up for a 4 week free trial to test drive the site, and see if my work can help in your trading and if it meets your requirements.
If you don't like what you see, then drop me an email within the 1st 4 weeks from when you join, and ask for a no questions refund.
You simply have nothing to lose.
By Jason Soni AKA Nouf
© 2011 Copyright Jason Soni AKA Nouf - All Rights Reserved
Disclaimer: The above is a matter of opinion provided for general information purposes only and is not intended as investment advice. Information and analysis above are derived from sources and utilising methods believed to be reliable, but we cannot accept responsibility for any losses you may incur as a result of this analysis. Individuals should consult with their personal financial advisors.
© 2005-2022 http://www.MarketOracle.co.uk - The Market Oracle is a FREE Daily Financial Markets Analysis & Forecasting online publication.