


Stock Market Odds Still Favour a New High
Stock-Markets / Stock Markets 2011 Jul 18, 2011 - 03:11 AM GMTBy: Andre_Gratian

 Very Long-term trend - The continuing strength in the indices is causing me to question whether we are in a secular bear market or two consecutive, cyclical bull/bear cycles. In any case, the very-long-term cycles are down and, if they make their lows when expected, there will be another steep and prolonged decline into 2014-16 (no change).
Long-term trend - In March 2009, the SPX began a move which evolved into a bull market. Cycles point to a continuation of this trend for several more weeks.
SPX: Intermediate trend - The SPX has probably completed its correction, but there may be some additional consolidation before it makes a new high (no change).
Analysis of the short-term trend is done on a daily basis with the help of hourly charts. It is an important adjunct to the analysis of daily and weekly charts which discusses the course of longer market trends.
Market Overview
There is better than a fifty-fifty chance that the consolidation of the intermediate trend ended on Friday. Here are the reasons why it may have -- and why we cannot yet be 100% certain:
-- A 9-mo cycle low was due in this time frame. It could still bottom next week, but there are signs that it may have bottomed on Friday. What is unclear at this time, is what kind of a rally will develop from here if one is to start.
-- The rally from 1265 ended with a small Head & Shoulders pattern which is very noticeable on a 60m chart, as we will see later. The low of 1306.51 satisfies the H&S projection.
-- The 1356 top made a distribution pattern with a total downside projection to 1299, but also had an interim phase projection to 1306 filled by the low made on 7/13. Since most of the downside projection has been met, it was conceivable that a reversal of the near-term trend could be made from this level. But since the index still has the potential to reach its extreme target of 1299, it will have to show us that it is not willing to go any lower.
-- On 7/13, the SPX had retraced 50% of its rally from 1265 to 1356. It subsequently went sideways and held that level for a whole week. In the last two hours on Friday, there was an uptrend which started near the low of the consolidation (at 1308.11), and which carried to its very top at 1306.30, coming within two points of what is needed for a break-out to take place.
-- The action of the last two days has caused the hourly indicators to give a buy signal by starting an uptrend. However, the A/D did not convincingly support the move and a confirmed break-out was not established. Monday will decide if we keep going or fall back!
-- The QQQ led the charge, which is a positive.
Let's look at some charts.
Chart Analysis
We'll start with the same medley of time frames for the SPX that I showed last week. This is a good way to get a total perspective of the market. Starting with the Weekly Chart, on the left, we can see why we don't have the greatest technical picture right now.
First, is the long term becoming a macrocosm of the short term? It is possible that an important Head & Shoulders pattern has been forming over the past six months. If it has, it would turn out to be an inversion of the bottom pattern prior to the uptrend, and the indicators are not denying this possibility. Neither the MSO nor the MACD has given a confirmed buy to the uptrend which started at 1265. If prices stall at 1256 or below, this will give increased credibility to the H&S pattern. However, because of other factors, at this time the H&S pattern is given a low probability rating.
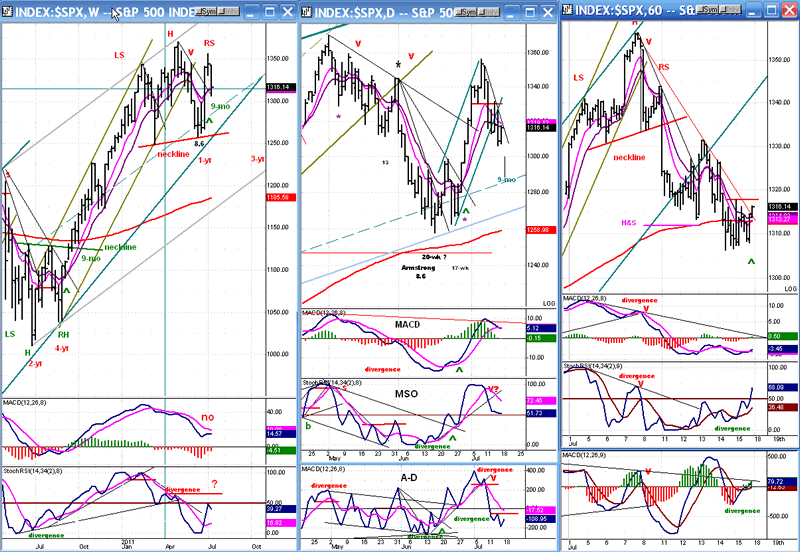
As of Friday, the Daily Chart was non-committal about the possibility that a reversal had taken place. The SPX, which had broken below its moving averages, has now rallied up to the lower one. It must cross them to the upside to signal an uptrend.
The two top indicators are still in a downtrend, but they are positive and the lowest one ticked up on Friday, although not enough to signal a reversal. From here, they could go either way and if it's down, it could signal another attempt to reach the lowest projection of 1299.
The Hourly Chart should give the bulls some hope. Last week, the SPX appeared to find good support at 1306 (the last interim P&F projection before the maximum target of 1299) and, since then, it has developed a bullish profile. The entire correction from 1356 looks like a zig-zag which completed at 1306 with a truncated 5th wave of the second pattern.
After touching 1306 and fulfilling the H&S requirement, the index built a two-day base which, on the P&F chart, measures 29 points -- enough to send prices back above 1331. This is the critical level which must be overcome for the SPX to get back into an uptrend. The action of the past few days not only arrested the decline, but the indicators developed positive divergence in the process. On Friday, the beginning of an (unconfirmed) uptrend clearly started.
The QQQ --which had been relatively weaker than the SPX during the decline from 1370, and which remained pretty much on an even basis with it during the pull-back from 1356 -- took the lead on the upside. This is potentially bullish, but it had a lot of help from Google which soared after Thursday's earnings report.
So why am I not more ecstatic about the prospects for a resumption of the uptrend? Only because we don't really have a confirmation, yet. Neither the DJIA, nor the SPX have confirmed a break-out from their consolidation pattern. As I mentioned earlier, the SPX needs two more points to get above the resistance level. Although it did close slightly outside of its downtrend line, neither the DJIA nor the RUT have broken their trend lines. This fact, and the unconvincing A/D activity makes the break-out questionable.
At best, the break-out was a mixed bag which will need a strong confirmation next week. If we don't get it, we will either extend the base for a few more days, or we could decline to the final target of 1299.
Cycles
The low of the 8.6-yr Martin Armstrong cycle could have been an important turning point for the market. In conjunction with some less important cycles, it may have been responsible for the correction from 1370, as well as for the resumption of the uptrend from 1258.
The 9-mo cycle was apparently influential in causing the consolidation from 1356. Since we are currently in the time frame when it is supposed to make its low, it may now be ready to take the market to a higher level.
There may be enough time for this to take place before the 3-yr cycle (due in October) begins to interfere with the uptrend.
Breadth
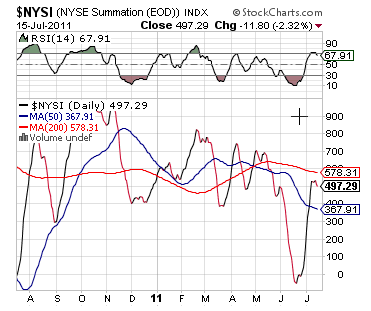
Last week, the Summation Index (courtesy of Stockharts.com) only had a very small correction relative to the stock market. This is encouraging action for the bulls, especially since it has now strongly rebounded in positive ground after a brief dip under zero.
The long-term pattern, however, is not as encouraging. Ever since its peak of October 2010, it has shown a decelerating trend which does not bode well for the longer term. It is a series of lower highs and lower lows that, if it continues, can only lead to an important market top.
Sentiment:
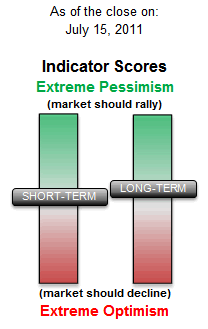
By contrast, the SentimenTrader (courtesy of same) is telling us that we should not worry too much about short-term negativity. There is still plenty of green showing in the long-term indicator -- where it counts the most! However, the short-term one is only neutral, and that would tend to put the market in a neutral near-term position, consistent with an unconfirmed attempt at breaking out on Friday.
The ratio of NDX to SPX is also giving us a short-term bullish picture. It has broken out of a downtrend line (you have to imagine it) going back to Last November.
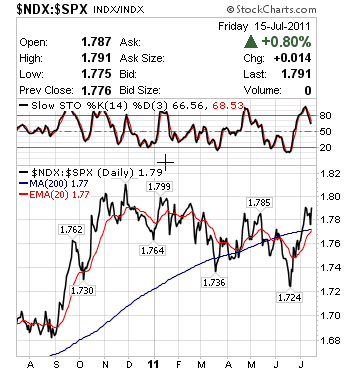
Note that in May, when 1370 was reached, this was one of the indicators that forecasted an imminent correction in the market. Now, it is sounding a more cheerful note, telling us that there is a good chance that the SPX will make a new high.
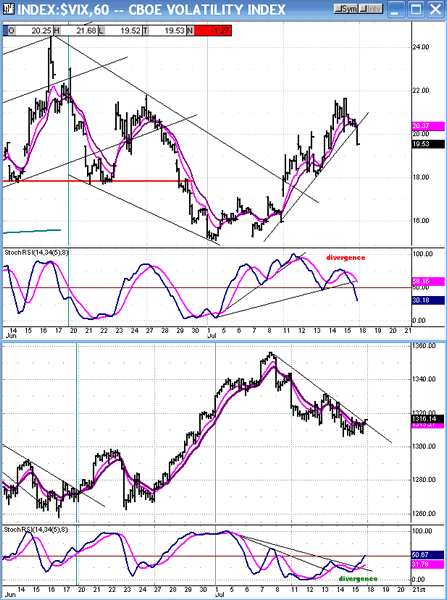
The VIX is another sentiment indicator which deserves our attention. Look at what it did on Friday! Its action was far more negative than the SPX's was positive. This gives the bulls some hope that the week's closing action was not simply engendered by the expiring options.
Note also on this hourly chart, that the indicators of both indices are showing divergence, giving us a warning that the trend might be about to change.
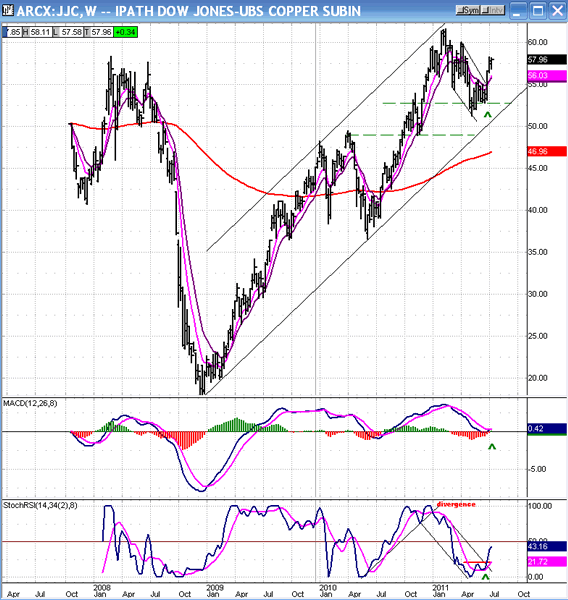
COPPER
It is time to re-visit Dr. Copper. It's been about a month since we last looked at its chart. At the time, it looked as if it could be ready to extend its uptrend. There is no longer any doubt.
The following is a weekly chart of JJC, the copper ETF. Dr. Copper has a tendency to lead the market. It made a bear market low almost three months before SPX, in December 2008, and made an intermediate high in mid-February, a couple of months before SPX. However, it did not make its previous bull market high until about 6 months after the equity indices, double-topping another four months later. Therefore, we cannot conclude with confidence that it will continue to lead the market but, if we turn to its P&F chart, we can at least get an idea of where the current up-move is heading. It has a target of 61, essentially a double top which, if this turns out to be correct, may forecast the next significant market top.
For now, the weekly indicators have just signaled a buy, so it should be clear sailing for the next few weeks.
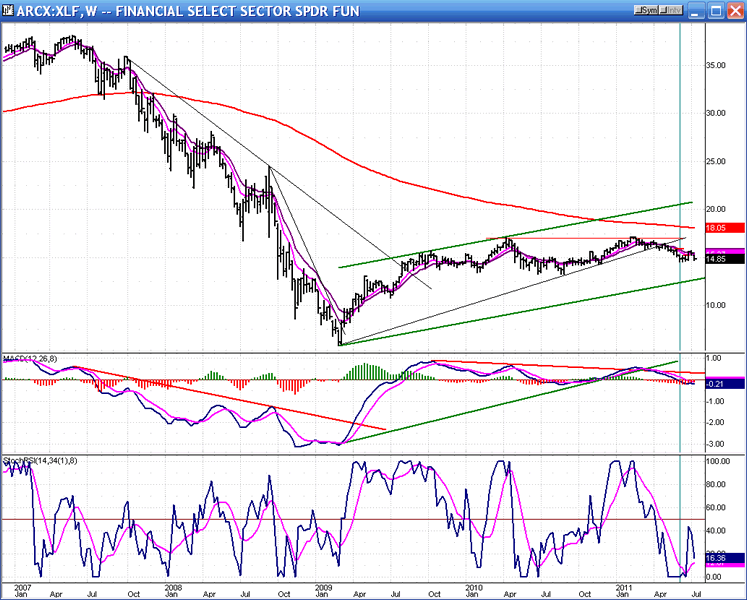
XLF - FINANCIAL SELECT SECTOR SPDR (weekly chart)
If we are going to be completely objective, we also have to consider this other time-tested indicator. It may even be a better leading indicator than Dr. Copper. XLF topped in May 2007, five months before the rest of the market, and it bottomed a week before SPX.
Its current chart is not very bullish! Since it made a bear market low, it has only managed to retrace 35% of its bear market decline, making a high on 4/10. In February 2011, it double-topped, and has been moving down ever since. On Friday, it almost returned to the low it made six weeks ago.
This index also needs to be watched carefully in the coming weeks. If it continues to drastically underperform the rest of the market and shows signs of wanting to break below its August 2010 low, it will be a big red flag! Especially if copper also begins to decline at the same time.
Summary
In the near term, the SPX appeared to start a break-out move at the end of the trading day, on Friday. In spite of some positive signals, the move lacked confirmation and it is now incumbent on Monday's trading to provide the needed follow-through.
In regard to the medium term, whether or not the break-out is confirmed on Monday, the odds still favor a move to new highs, most likely into an important top! The entire corrective move from 2/22 may be that of a triangle which completed last week.
There are storm clouds gathering on the horizon for the longer term. The major cycles due to make their lows in 2014-15 cannot allow this uptrend to continue much longer. Sooner, rather than later, they will begin to exert a downward pressure which will overcome the upward lift of the lesser cycles that caused this bull market and which, in any case, are near the peaks of their phases.
FREE TRIAL SUBSCRIPTON
If precision in market timing for all time frames is something which is important to you, you should consider a trial subscription to my service. It is free, and you will have four weeks to evaluate its worth.
For a FREE 4-week trial. Send an email to: ajg@cybertrails.com
For further subscription options, payment plans, and for important general information, I encourage you to visit my website at www.marketurningpoints.com. It contains summaries of my background, my investment and trading strategies and my unique method of intra-day communication with Market Turning Points subscribers.
By Andre Gratian
MarketTurningPoints.com
A market advisory service should be evaluated on the basis of its forecasting accuracy and cost. At $25.00 per month, this service is probably the best all-around value. Two areas of analysis that are unmatched anywhere else -- cycles (from 2.5-wk to 18-years and longer) and accurate, coordinated Point & Figure and Fibonacci projections -- are combined with other methodologies to bring you weekly reports and frequent daily updates.
“By the Law of Periodical Repetition, everything which has happened once must happen again, and again, and again -- and not capriciously, but at regular periods, and each thing in its own period, not another’s, and each obeying its own law … The same Nature which delights in periodical repetition in the sky is the Nature which orders the affairs of the earth. Let us not underrate the value of that hint.” -- Mark Twain
You may also want to visit the Market Turning Points website to familiarize yourself with my philosophy and strategy.www.marketurningpoints.com
Disclaimer - The above comments about the financial markets are based purely on what I consider to be sound technical analysis principles uncompromised by fundamental considerations. They represent my own opinion and are not meant to be construed as trading or investment advice, but are offered as an analytical point of view which might be of interest to those who follow stock market cycles and technical analysis.
Andre Gratian Archive |
© 2005-2022 http://www.MarketOracle.co.uk - The Market Oracle is a FREE Daily Financial Markets Analysis & Forecasting online publication.