


Stock Market Fall Portends Poorly for Corporate Earnings Season
Stock-Markets / Stock Markets 2011 Jul 18, 2011 - 06:43 AM GMTBy: Money_Morning

 Jon D. Markman writes:
Last week's stock market decline was largely the product of geopolitical events ranging from the debt-ceiling impasse and rating agency warnings to new Italian and Greek sovereign debt troubles.
Jon D. Markman writes:
Last week's stock market decline was largely the product of geopolitical events ranging from the debt-ceiling impasse and rating agency warnings to new Italian and Greek sovereign debt troubles.
But what's really scary is that a weak week for stocks may well carry into the bulk of earnings season, which comes up next week when 40% of the market capitalization of the Standard & Poor's 500 Index reports second-quarter results.
The S&P 500 fell 3.3% over the course of the week, weighed down by 5% loss in financials.
And beneath the surface, the gains were not that impressive even on the best day of the week, as breadth was just slightly positive on Friday and only 111 stocks across the three major exchanges jumped out to new one-year highs.
Economic data was not supportive of any gains during the week, leading Goldman Sachs Group Inc. (NYSE: GS) to reportedly to lower its forecast for second- and third-quarter gross domestic product (GDP) growth to less than 1.5% and 2.5%, which is dangerously close to stall speed.
The only really impressive earnings report came from Google Inc. (Nasdaq: GOOG), which said it earned $8.74 per share in the second quarter, more than the $7.85 that Wall Street had anticipated, after special items.
The report was pretty clean. The company reported that Google-owned site revenues jumped 39% year-over-year, while partner sites generated sales growth of 20%. Shares jumped 12%, their biggest move in a year.
Over in merger-land, the big news of the week came from Aussie materials conglomerate BHP Billiton Ltd. (NYSE ADR: BHP), which made a bid for U.S. gas producer Petrohawk Energy Corp. (NYSE: HK), while The Clorox Co. (NYSE: CLX) investors cleaned up with an acquisition bid by activist investor Carl Icahn. These bids are arriving because stocks are cheap and companies and private funds are flush with cheap money.
With all that good news you would think the market would have been able to shake off its blues but there were a lot of economic data points that weighed down the mood. The news Friday alone was emblematic.
Industrial production was up 0.2% in June, which was a disappointment to the consensus looking for 0.3% or more. Worse was that May's already crummy 0.1% increase was revised away to reflect a 0.1%, while April's flat reading also was revised downward to reflect a 0.1% drop.
The culprit: Expectations of a big boost in June in the U.S. arms of Toyota Motor Corp. (NYSE ADR: TM) and Honda Motor Co. (NYSE ADR: HMC) skidded into the ditch. Production of motor vehicles and parts sank 2% last month, the third decline in a row. Excluding the motor vehicles and parts industry, analysts noted that production did manage a 0.3% gain.
Manufacturing overall managed a 0.1% gain, the most in three months, even as hours worked in the sector fell.
BMO Financial Group analysts pointed out the unsettling news that production of business equipment (one of the two "bright spots" that Federal Reserve Chairman Ben Bernanke pointed out in his Congressional testimony last week) fell 0.7%, the third drop in the past four months.
Companies are likely waiting to see if employment improves and the debt talks are resolved.
Overall industrial production in the three months through June gained for the eighth consecutive quarter, but the 0.2% rise in the period was the weakest in that stretch.
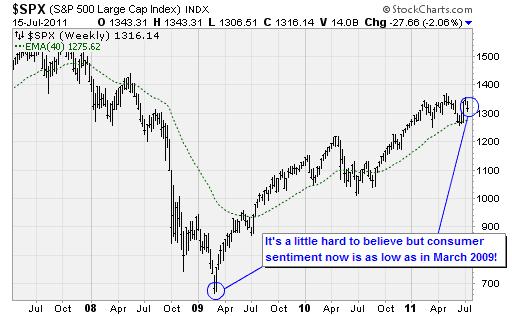
Now let's talk about people's feelings.
The University of Michigan Consumer Sentiment Index dropped 7.7 points in early July to the lowest level since March 2009. That was the depth of the bear market!
With all the talk about the U.S. government defaulting on its debt (an inconceivable concept) and the possibility of Americans not receiving Social Security or Veterans' checks, it's no wonder people's emotions are in the dumps.
Island Reversal
We all know that debt ceiling debate is a high-stakes game of chicken, as there is virtually no way the two sides will blow up the nation's AAA credit rating over a measly couple of trillion dollars. Yet this unseemly mess is undermining European and Asian creditors' view of the seriousness of the U.S. political process, and will likely lead to a continuation of Friday's equity sell-off on Monday.
Breadth has been the hallmark of the recent advance, but it was terrible the past two weeks, with losers outpacing gainers by a four-to-one margin. Just 140 stocks made new highs in the three major U.S. exchanges on Friday, a low for the past three weeks.
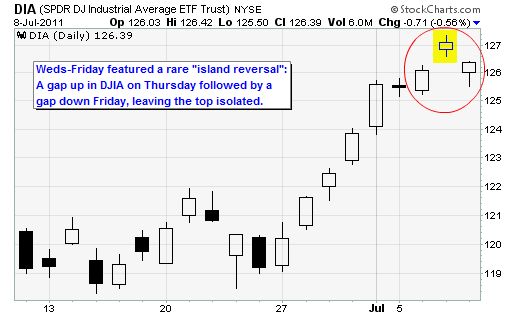
Worse, when you look back at the sequence of trading the past two weeks, you can see a rare "island reversal" in the chart of the exchange traded fund representing the Dow Jones Industrial Average, as shown above.
An island reversal occurs when a market or stock gaps up on what is believed to be good news one day, only to gap down the next day either on subsequent bad news or profit taking. The key identifier is that, in a three-day sequence, there is no overlap in the pricing on Day 2 with Day 1 or Day 3. A lot of the most long-lasting tops start this way. Island reversals tend to be rally killers. But it does not always have to be that way, and bulls will still have an opportunity to recover if they act quickly.
Jason Goepfert reports that this pattern is extremely rare in major indexes: The S&P 500 has shown it just three other times. You can't tell much from three instances. But if you look at island reversals in the components of the S&P 500, it has occurred 592 times in the past 15 years. It led to a positive return the next day in only 47% of the cases, a higher price 50% in the next three days, but a month later prices were lower in the majority of cases.
If you stipulate that the stocks had to be within 2% of their 52-week high during the island reversal, then forward returns become more negative.
This may sound like technical mumbo-jumbo, but what it really represents is investor psychology. It helps answer the question: What do investors tend to do when they receive an upside surprise stimulus followed by a downside surprise stimulus when they are already predisposed toward optimism? The answer is that, over the next month at least, the negative stimulus tends to leave a mental and emotional bruise that shows up in price charts as a decline.
How could fortunes switch so quickly from the surge of the first week of the month?
There is a lot of posturing going on in politics right now that investors are picking up on, and they are translating them into a murkier view on earnings prospects. Few moves in the market or politics are ever what they appear to be on the surface in real time, and the pronouncements we see in the media by political leaders may be a cover for what is really going on behind the scenes.
Basically I think there is an increasing lack of trust between major investors and the political process. I realize that has been going on since the dawn of time. But there is an extra edge lately.
Peering Through the Politics
At the risk of sounding like a conspiracy theorist, the evidence shows that President Obama and Fed Chairman Bernanke have proven to be ready to manipulate markets for purposes they apparently believe are for the public good but may also provide political benefits. I'm not complaining about this mind you, I'm just stating the facts.
Just for recent touch points, consider the sudden increase in margin requirements for silver a couple of months ago, the sudden release of crude oil from strategic reserves last month (which helped set the bottom of the market in late June) or last year's sudden quantitative easing and super-low interest rates. All were personal, major efforts by officials to influence market behavior in profound ways.
Now speed forward to the present. June's unemployment rate came in much, much lower than independent analysts' expectations. Why? Well, business cycle expert Lakshman Achuthan has told us that employment is in cyclical decline. But from a practical standpoint, my guess is that some levers were thrown in the calculation of the jobless calculation.
There's a lot that can be done with seasonal adjustments and other factors much more hidden, and Bureau of Labor Statistics managers in charge of data crunching are political appointees. Also, as for the unemployment rate, which is derived from the household data series, my understanding is that until recently it was calculated off a two-year average of employment. I gather the BLS has recently moved to a five-year average. At the tail end of that period, 2006-2007, employment was peaking.
The reason the administration would do this: If you are running for office next year, it does not matter how bad the unemployment rate is in2011. It matters what the employment rate is in the summer of 2012. And so what is an unemployment "rate" anyway? It is a percentage of something. That means the denominator, or the number that you are basing the rate on, matters a lot.
Five years ago, employment was relatively high. But a year later, employment was faltering. So next year, during the election cycle, the denominator for the unemployment rate will be lower -- which means that even if absolute employment numbers remain static, theratewill automatically decline because those numbers will be measured against a lower number in the past. In other words, the unemployment rate could fall to 7% or 8% ahead of the election even if there is no improvement in jobs.
We can't be sure that this is what the BLS had in mind, or whether it was politically influenced. But trust me on this: officials can and will manipulate the data and try to fool the markets in this way.
The bottom line is that the government has a good reason for making unemployment seem high now so that it can make it look lower during the election cycle. This is something that occurred during the Bush Administration as well, but it's being done with more sophistication now. As a result, markets will adjust both to the lower numbers and to the eroding trust in reported data.
From the market perspective, we now have a standoff, the bulls and bears looking at each other over the barricades with a gleam in their eyes -- each believing that they have the wherewithal to take down the other.
I would love to be optimistic, but that data that I see suggests the world has entered into a cyclical industrial slowdown that has crippled business confidence and job growth. So even if second-quarter earnings are good, corporate outlooks will be poor. And ultimately that means stock prices will peak.
The Week Ahead
July 18: NAHB Housing market Index.
July 19: Housing Starts.
July 20: MBA Mortgage Purchase Index. Existing Home Sales.
July 21: Initial Unemployment Claims.
Source :Source :http://moneymorning.com/2011/07/18/last-weeks-stock-market-decline-portends-poorly-for-earnings-season/
Money Morning/The Money Map Report
©2011 Monument Street Publishing. All Rights Reserved. Protected by copyright laws of the United States and international treaties. Any reproduction, copying, or redistribution (electronic or otherwise, including on the world wide web), of content from this website, in whole or in part, is strictly prohibited without the express written permission of Monument Street Publishing. 105 West Monument Street, Baltimore MD 21201, Email: customerservice@moneymorning.com
Disclaimer: Nothing published by Money Morning should be considered personalized investment advice. Although our employees may answer your general customer service questions, they are not licensed under securities laws to address your particular investment situation. No communication by our employees to you should be deemed as personalized investent advice. We expressly forbid our writers from having a financial interest in any security recommended to our readers. All of our employees and agents must wait 24 hours after on-line publication, or 72 hours after the mailing of printed-only publication prior to following an initial recommendation. Any investments recommended by Money Morning should be made only after consulting with your investment advisor and only after reviewing the prospectus or financial statements of the company.
Money Morning Archive |
© 2005-2022 http://www.MarketOracle.co.uk - The Market Oracle is a FREE Daily Financial Markets Analysis & Forecasting online publication.