


UK Housing Market Sellers Forced to Cut Asking Prices, Still 16% Over Valued
Housing-Market / UK Housing Jul 19, 2011 - 04:54 AM GMTBy: Nadeem_Walayat

 Rightmove, Britain's largest online estate agency is reporting that UK home sellers have cut their asking prices for the first time this year, by dropping them by 1.6% this month. The BBC further estimated that this still leaves national seller asking prices over valued by 16% at £236,597 against the average actual sale price of £203,528 on the DCLG valuations measure (implies 40%! over valuation on other house price indices such as the Halifax).
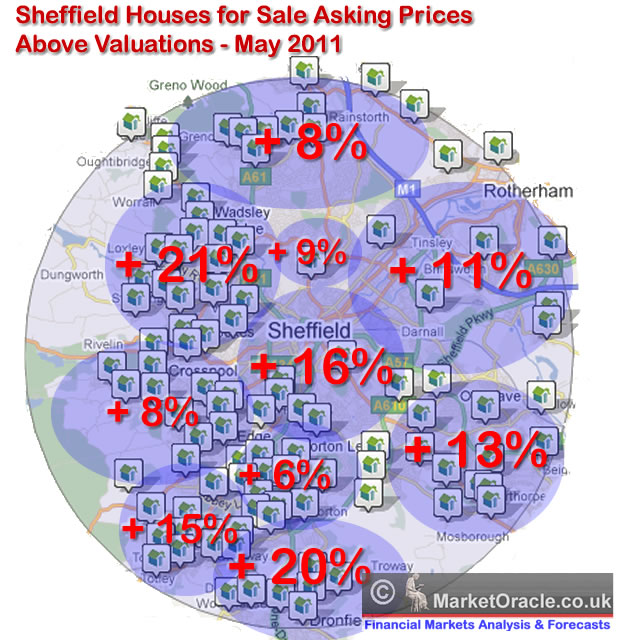
The national findings are inline with my own earlier analysis for the city of Sheffield which concluded in an average over valuation of asking prices by 13% (UK Property Sellers Inflated Asking Prices Risks Chasing After House Prices Downward Spiral). However as the below graph illustrates the city-wide average masks wide variations between areas that range between properties typically being 6% to 21% over valued, where the level of affluence or poverty is not necessarily a determining factor for the differences between areas of a city.
Determining Factors for Seller High Asking Prices
 Since my May 2011 analysis, further research into the reasons for the differences in asking prices against valuations between areas has revealed the following possible explanations that are just as valid for most UK cities as they are for Sheffield:
- Population Growth and Decline- Some areas of the city are witnessing falling or stagnant populations, which usually effects the mid range properties of an area rather than those at the higher or lower end, such as the East and the South of the City, which results in those seeking to sell properties over inflating asking prices as they compare general price trends across the city against their own properties expectations. The effect can be as serious as making the difference between 50% price increase over 10 years and zero increase or even a price fall.
- Local Schools Changing Performance - House prices can be effected in both directions if the local schools improve or decline in performance over time, which may fail to register with home sellers as their children may have grown up many years ago.
- Rivers - Up until June 2007 when Sheffield was hit with the Great Flood, many Sheffielders had never taken the issue of flooding seriously, however that no longer applies where the path of Sheffield's many rivers has negatively impacted on house prices that are deemed to be at risk of flooding and therefore likely to incur difficulty in insuring, which effects both affluent and the poorer areas equally, where a matter of a 100 metres can effect similar houses to the difference of as much as 25% in price as well as resulting in greater supply on the market as these flood risk housing is more likely to remain on the market for far longer than properties elsewhere. The same holds true for all of the UK's major cities that are built on canal and river water ways.
- New Houses - New housing stock usually from the low to middle price range areas of the city are unlikely to appreciate much during the first 10 years. Which can result in over valuations by sellers as they price their houses in terms of how average properties in their area's have appreciated.
- Cluster of Valuations - Over valuations and realistic valuations tend to cluster by area's because home sellers tend to look at what price others in an area are also selling for and therefore price according to the competition.
- Competing Estate Agents - There may be greater competition in overvalued areas between estate agents for business therefore a tendency to give properties higher valuations so as to secure business and shut out other agents, then a few months down the road when properties have failed to sell ask clients to cut asking prices.
- Crime Rates - Even a few bad crime stories of shootings and killings can have a significant and lasting effect on buyer demand for an area as well as the longer-term trends for crimes such as burglaries.
- Social Housing - Areas with more social housing will tend to see less appreciation in house prices, which may not be reflected in asking prices.
- No or Negative Equity - Home owners trapped into no or negative equity properties will find it difficult to price their properties at a level that the market will bear. Those most likely to be in negative equity will have many of the contributing factors as listed above and be unwilling to accept less than their outstanding debt.
- National Events Skewing Seller Expectations - One off national events can impact on Seller expectations such as is with the case of the Olympics in London, which has resulted in an estimated 10% inflation in asking prices even allowing for rising selling prices. The question mark is will London Sellers still be pricing in an Olympics premium after the Olympics? Meanwhile they can enjoy the boost for another year.
- Public Sector Recession - Just as the Olympics are boosting London, so is the public sector recession as a consequence of 500,000 planned job losses to depress areas where public sector works tend to reside and that impacts harder on Northern UK cities such as Sheffield, Liverpool, Newcastle than Southern cities. Therefore Sellers in cities such as Sheffield may not be taking into account the consequents of a contracting public sector which will hit those areas of the city that rely more heavily on the public sector for employment i.e. the middle income bracket areas, hence expectations for sharply higher supply could result in a very wide margin of difference between seller expectations and what the market is prepared to pay.
- Artificially Low Interest Rates - The current rate of inflation is 5% whilst the base interest rate is 0.5%. This results in low seller financing costs for mortgages and therefore reluctance for Sellers to market their properties in line with market demand. However sellers are playing a dangerous game as once interest rates do start to rise then they will see sharply higher debt financing costs, especially as market interest rates will move ahead of the base interest rate as well as coupled with less buyer interest as they are also similarly squeezed in terms of what they will be able to afford.
The net effect of the prevalence of over valued asking prices is for an ever increasing supply of property that will further put downward pressure on house prices especially in specific areas of cities, this is reflected in official statistics which show that 70% of properties on the market have failed to sell this year hence sellers starting to cut asking prices.
Sellers
Grossly over valued properties will fail to sell, thus sellers risk chasing the market ever lower remaining just out of reach of buyer interest. Therefore sellers need to get multiple valuations to get a more realistic price and if their property fails to attract any interest to not delay in cutting their asking price by a significant margin i.e. in steps of 10% so as to attract buyer interest. Else you risk wishing you had cut earlier and thus obtained a higher final sale price.
Buyers
Given that the average asking price is estimated at 16% above valuations, It seriously pays for Buyers to do their own research, look at what similar previous properties actually sold for in the area you are targeting. If a house looks fairly priced compared against others in the area then ensure that there is not a reason why it differs in price, which may be due to issues such as the property is leasehold instead of freehold, or that there is an issue for instance with flooding.
Expand your analysis of house prices city wide so that you can appreciate if areas are over or more fairly valued as there is a tendency for over valuations to cluster in areas as sellers tend to price according to what other sellers in an area are expecting to achieve.
Where future house price appreciation is concerned the most important consideration is location, however that does not mean that all of today's positive reasons will still be in place in the future when you also decide to sell and move on, so you need to appreciate the direction an area is trending as a result in changing populations. But the higher relative priced areas offers a better chance of maintaining an area's relative status and future price trend over time.
So if you want to maximise future house price growth then buy a smaller house in a more expensive area rather than a larger house in a cheaper area.
The bottom line is that given the level of unrealistic seller fantasy land asking prices, buyers should not be afraid of making deeply discounted offers, typically starting at 10% and perhaps as high as 20% depending on area specifics.
UK House Price Trend
The UK housing market depression continues as Labours election bounce has long since evaporated, many home owners relieved that the house price crash had stopped during early 2009 had put their plans to sell on the back burner as they envisaged a return to the 'norm' of rising house prices, this expectation continued even after the coalition government took office and announced unprecedented spending cuts and tax rises during mid 2010, that started on schedule in April 2011.
Last forecast (03 Sep 2010 - UK House Prices and GDP Growth Trends Analysis) concluded in a continuing depression in the UK housing market for the next 3-4 years, with the most probable outcome being for a gradual shallow drift lower in prices over the next 1-2 years (6-12%), followed by a further 1-2 years of base building.
The Inflation Mega-Trend (E-Book FREE Download) continues to eat into household incomes as official inflation is running at between 4.2% to 5.2% whilst average wage increases are running at 2% or less per annum. On top of this we have the still mostly bankrupt banks reluctant to lend as they prepare to line up for more tax payer cash (capital injections) as a consequence of the inevitable sovereign debt defaults starting with Greece which I covered at length recently in (Bankrupt Greece Blackmails Europe, Bailout or Euro Zone Dies, Global Financial System Collapse).
My next in-depth analysis will look at the expected impact of the Inflation Mega-trend on UK house prices.
This analysis forms part of series that aims to conclude towards a multi-year trend forecast for UK house prices that aims to replicate the accuracy of past analysis (more than 150 housing market analysis articles) and concluding trend forecasts as illustrated by the first graph, including the original forecast made right at the very peak of the UK housing market in August 2007:
22 Aug 2007 - UK Housing Market Crash of 2007 - 2008 and Steps to Protect Your Wealth
The UK Housing market is expected to decline by at least 15% during the next 2 years. Despite the 2012 Olympics, London is expected to fall as much as 25%. UK Interest rates are either at or very near a peak, as there is an increasingly diminishing chance of a further rise in October 2007. After which UK interest rates should be cut as the UK housing market declines targeting a rate of 5% during the second half of 2008. The implications for this are that the UK economy is heading for sharply lower growth for 2008.
Ensure you are subscribed to my always free Newsletter to receive in depth analysis and forecasts in your email in box (only requirement is a valid email address).
Source and Comments: http://www.marketoracle.co.uk/Article29357.html
By Nadeem Walayat
Copyright © 2005-2011 Marketoracle.co.uk (Market Oracle Ltd). All rights reserved.
Nadeem Walayat has over 25 years experience of trading derivatives, portfolio management and analysing the financial markets, including one of few who both anticipated and Beat the 1987 Crash. Nadeem's forward looking analysis focuses on UK inflation, economy, interest rates and housing market. He is the author of three ebook's - The Inflation Mega-Trend; The Interest Rate Mega-Trend and The Stocks Stealth Bull Market Update 2011 that can be downloaded for Free.
Nadeem is the Editor of The Market Oracle, a FREE Daily Financial Markets Analysis & Forecasting online publication that presents in-depth analysis from over 600 experienced analysts on a range of views of the probable direction of the financial markets, thus enabling our readers to arrive at an informed opinion on future market direction. http://www.marketoracle.co.uk
Disclaimer: The above is a matter of opinion provided for general information purposes only and is not intended as investment advice. Information and analysis above are derived from sources and utilising methods believed to be reliable, but we cannot accept responsibility for any trading losses you may incur as a result of this analysis. Individuals should consult with their personal financial advisors before engaging in any trading activities.
Nadeem Walayat Archive |
© 2005-2022 http://www.MarketOracle.co.uk - The Market Oracle is a FREE Daily Financial Markets Analysis & Forecasting online publication.