Climate Change Investing in Rare Earth Metals, Energy and Fertilizers
Commodities / Investing 2011 Jul 23, 2011 - 02:18 AM GMTBy: Richard_Mills
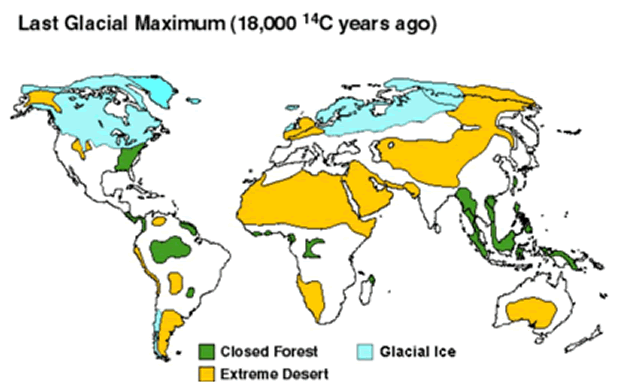
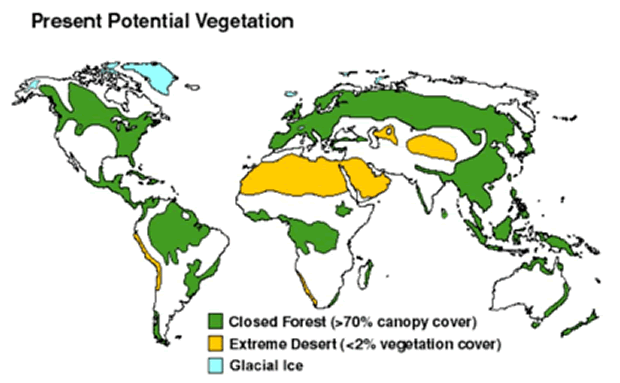
 The Earth's climate has been continuously changing throughout its history. From ice covering large amounts of the globe to interglacial periods where there was ice only at the poles - our climate and biosphere have been in flux for millennia.

geocraft.com
This temporary reprieve from the ice we are now experiencing is called an interglacial period - the respite from the cold locker began 18,000 years ago as the earth started heating up and warming its way out of the Pleistocene Ice Age.

geocraft.com
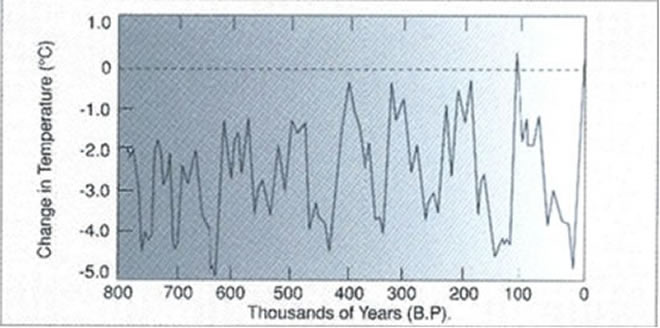
Approximately every 100,000 years or so our climate warms up temporarily.

These interglacial periods usually last somewhere between 15,000 to 20,000 years before another ice age starts. Presently we’re at year 18,000 of the current warm spell.
Serbian astrophysicist Milutin Milankovitch is best known for developing one of the most significant theories relating to Earths motions and long term climate change.
Milankovitch developed a mathematical theory of climate change based on the seasonal and latitudinal variations in the solar radiation received by the Earth from our Sun - it was the first truly plausible theory for how minor shifts of sunlight could make the entire planet's temperature swing back and forth from cold to warm.
Milankovitch’s Theory states that as the Earth travels through space around the sun, cyclical variations in three elements of Earth/sun/geometry combine to produce variations in the amount of solar energy that reaches us. These three elements are:
- Variations in the Earth's orbital eccentricity - the shape of the orbit around the sun, a 100,000 year cycle
- Changes in obliquity or tilt of the earth’s axis - changes in the angle that Earth's axis makes with the plane of Earth's orbit, a 41,000 year cycle
- Precession - the change in the direction of the Earth's axis of rotation, a 19,000 to 23,000 year cycle
These orbital processes are thought to be the most significant drivers of ice ages and, when combined, are known as Milankovitch Cycles.
Other Climate Change Drivers:
- Changes occurring within the sun affects the intensity of sunlight that reaches the Earth's surface. These changes in intensity can cause either warming - stronger solar intensity - or cooling when solar intensity is weaker.
- Volcanoes often affect our climate by emitting aerosols and carbon dioxide into the atmosphere. Aerosols block sunlight and contribute to short term cooling, but do not stay in the atmosphere long enough to produce long term change. Carbon dioxide (CO2) has a warming effect. For about two-thirds of the last 400 million years, geologic evidence suggests CO2 levels and temperatures were considerably higher than present. Each year 186 billion tons of carbon from CO2 enters the earth's atmosphere - six billion tons are from human activity, approximately 90 billion tons come from biologic activity in earth's oceans and another 90 billion tons from such sources as volcanoes and decaying land plants
These climate change “drivers” often trigger additional changes or “feedbacks” within the climate system that can amplify or dampen the climate's initial response to them:
- The heating or cooling of the Earth's surface can cause changes in greenhouse gas concentrations - when global temperatures become warmer, CO2 is released from the oceans and when temperatures become cooler, CO2 enters the ocean and contributes to additional cooling.
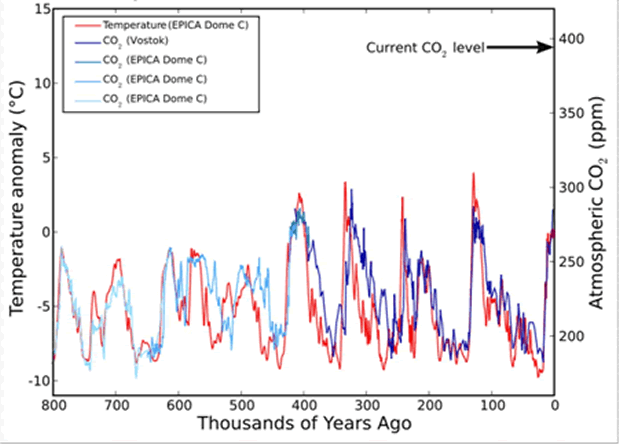
During at least the last 650,000 years, CO2 levels have tracked the glacial cycles - during warm interglacial periods, CO2 levels have been high and during cool glacial periods, CO2 levels have been low
- The heating or cooling of the Earth's surface can cause changes in ocean currents. Ocean currents play a significant role in distributing heat around the Earth so changes in these currents can bring about significant changes in climate from region to region
In 1985 the Russian Vostok Antarctic drill team pulled up cores of ice that stretched through a complete glacial cycle. During the cold period of the cycle CO2 levels were much lower than during the warm periods before and after. When plotted on a chart the curves of CO2 levels and temperature tracked one another very closely – methane, an even more potent greenhouse gas, showed a similar rise and fall to that of CO2.

Small rises or falls in temperature - more, or less sunlight - seemed to cause a rise, or fall, in gas levels. Changing atmospheric CO2 and methane levels physically link the Northern and Southern hemispheres, warming or cooling the planet as a whole. In the 1980s the consensus was that Milankovitch’s Cycles would bring a steady cooling over the next few thousand years.
As studies of past ice ages continued and climate models were improved worries about a near term re-entry into the cold locker died away – the models now say the next ice age would not come within the next 10,000 years.
It’s obvious that the orbital changes, as explained by Milankovitch’s Theory, initiate a powerful feedback loop. The close of a glacial era comes when a shift in sunlight causes a slight rise in temperature - this raises gas levels over the next few hundred years and the resultant greenhouse effect drives the planet's temperature higher, which drives a further rise in the gas levels and so on.
The exact opposite happens when sunlight weakens, we get a shift from emission to absorption of gases which causes a further fall in temperature... and so forth.
How Higher Temperatures effect Food Production
The study Climate Trends and Global Crop Production Since 1980 compared yield figures from the Food and Agriculture Organization (FAO) with average temperatures and precipitation in major growing regions.
Results indicated average global yields for several of the crops studied responded negatively to warmer temperatures. From 1981 - 2002, warming reduced the combined production of wheat, corn, and barley - cereal grains that form the foundation of much of the world's diet - by 40 million metric tons per year.
The authors said the main value of their study was that it demonstrated a clear and simple correlation between temperature increases and decreased crop yields at the global scale.
"Though the impacts are relatively small compared to the technological yield gains over the same period, the results demonstrate that negative impacts are already occurring." David Lobell, lead researcher
Other researchers who focused on wheat, rice, corn, soybeans, barley and sorghum (these crops account for 55 percent of non-meat calories consumed by humans and contribute more than 70 percent of the world's animal feed) reported that each had a critical temperature threshold above which yields started plummeting, for example: 29°C for corn and 30°C for soybeans. At the International Rice Research Institute in the Philippines scientists have found that the fertilization of rice seeds falls from 100 per cent at 34 degrees to near zero at 40 degrees.
By 2050, the world's population is expected to reach around nine billion - minimum and maximum projections range from 7.4 billion to 10.6 billion.
"Future food-production increases will have to come from higher yields. And though I have no doubt yields will keep going up, whether they can go up enough to feed the population monster is another matter. Unless progress with agricultural yields remains very strong, the next century will experience sheer human misery that, on a numerical scale, will exceed the worst of everything that has come before". Norman Borlaug, father of the Green Revolution
Unfortunately the Green Revolutions high yield growth is tapering off and in some cases declining. So far this is mostly because of an increase in the price of fertilizers, other chemicals and fossil fuels, but also because the overuse of chemicals has exhausted the soil and irrigation has depleted water aquifers.
If we are to stay in this current inter-glacial period for up to another 10,000 years, as current climate models predict, are we going to see regular occurrences of temperatures rising above plants critical flowering thresholds?
Considering population growth, draining of fresh water aquifers and declining plant yields it seems as if the supplies for drinking water/irrigation, and food, are going to come under increasing pressure while at the same time demand is going to increase.
Nuclear power (while reducing greenhouse gases in the atmosphere) where used for desalination of seawater would supply fresh water for the most parched areas of the globe while reliving strain on area aquifers. Farmers are going to have to grow more food on less acreage which means increased use of fertilizers.
Rare Earth Elements (REE) applications are highly specific and substitutes are inferior or unknown. REE are environmentally friendly, reducing CO2 levels, and are going to continually come under greater supply pressure as demand increases, for example:
- Rechargeable batteries
- Automotive pollution control catalysts
- Neodymium is key to the permanent magnets used to make high-efficiency electric motors. Two other REE minerals - terbium and dysprosium – are added to neodymium to allow it to remain magnetic at high temperatures
- Y, La, Ce, Eu, Gd, and Tb are used in the new energy-efficient fluorescent lamps. These energy-efficient light bulbs are 70% cooler in terms of the heat they generate and are 70% more efficient in their use of electricity
- Rare-earth elements are used in the nuclear industry in control rods, as dilutants, and in shielding, detectors and counters
- Rare metals lower the friction on power lines, thus cutting electricity leakage
The rechargeable power needs of our modern society has made lithium a serious player in the commodity markets, and no segment is more important than electric vehicles (EVs). EVs have far fewer moving parts than Internal Combustion Engine (ICE) gasoline-powered cars - they don't have mufflers, gas tanks, catalytic converters or ignition systems, there’s also never an oil change or tune-up to worry about getting done. Plug and go, pretty convenient and very green!
But the clean and green doesn’t end there - electric drives are more efficient then the drives on ICE powered cars. They are able to convert more of the available energy to propel the car therefore using less energy to go the same distance. And applying the brakes converts what was simply wasted energy in the form of heat to useful energy in the form of electricity to help recharge the car’s batteries.
Are nuclear energy, fertilizers, lithium and rare earths on your radar screen?
If not, maybe it should be.
By Richard (Rick) Mills
If you're interested in learning more about specific lithium juniors and the junior resource market in general please come and visit us at www.aheadoftheherd.com. Membership is free, no credit card or personal information is asked for.
Copyright © 2011 Richard (Rick) Mills - All Rights Reserved
Legal Notice / Disclaimer: This document is not and should not be construed as an offer to sell or the solicitation of an offer to purchase or subscribe for any investment. Richard Mills has based this document on information obtained from sources he believes to be reliable but which has not been independently verified; Richard Mills makes no guarantee, representation or warranty and accepts no responsibility or liability as to its accuracy or completeness. Expressions of opinion are those of Richard Mills only and are subject to change without notice. Richard Mills assumes no warranty, liability or guarantee for the current relevance, correctness or completeness of any information provided within this Report and will not be held liable for the consequence of reliance upon any opinion or statement contained herein or any omission. Furthermore, I, Richard Mills, assume no liability for any direct or indirect loss or damage or, in particular, for lost profit, which you may incur as a result of the use and existence of the information provided within this Report.
© 2005-2022 http://www.MarketOracle.co.uk - The Market Oracle is a FREE Daily Financial Markets Analysis & Forecasting online publication.


