


Making Sense Out of Stock Market Trading Environment
Stock-Markets / Stock Markets 2011 Jul 25, 2011 - 05:41 AM GMTBy: Dr_John_Trapp

 It is time for the market to speak clearly. I can make a case for many scenarios because not all the markets are in agreement. Let's review the markets and see if we can't make some sense out of the trading environment.
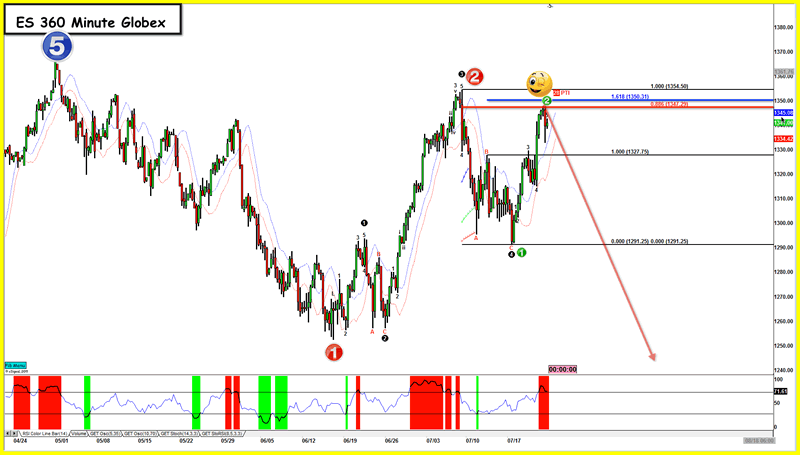
First, let's look at an update of Thursday night's posting for the action on Friday. Below is an updated 360 minute chart of ES with the arrow I drew for Friday's action. Yup, I projected a turn at the 88.6% retracement level after taking out Thursday's high. I can't get much closer than this. It's worth noting, however, that even though ES had a lower close, the Daily bar was Bullish with a higher high and higher low. The candle was a Doji though - indicating indecision and often is seen at a turning point. The question is whether the turn on Friday will stick and lead to more correction over the weeks ahead. The charts following this one will explore that question, but don't expect a clear answer. Maybe we will just get more questions. Until the market tells me otherwise, this chart is still my primary scenario.
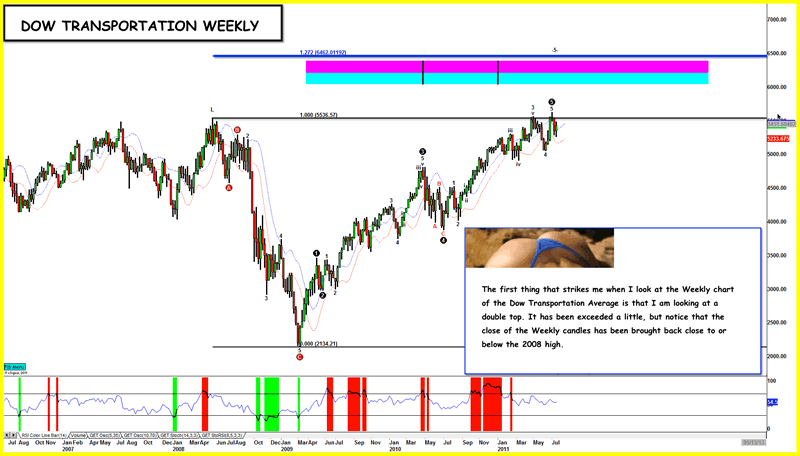
We could begin in a lot of places to analyze the market, but let's start with the leading Dow Transportation Average. At the Weekly interval on the next chart, I see a double top and I couldn't resist the artwork. Some might argue that this is a market knocking on a trendline for the 4th time and is ready to break through after challenging it several times while consolidating and coiling for an assault on a new high. So while this isn't conclusive, it does confirm that this leading indicator is at a significant resistance. A healthy close above this level should confirm that the market has more upside in it before making a top.
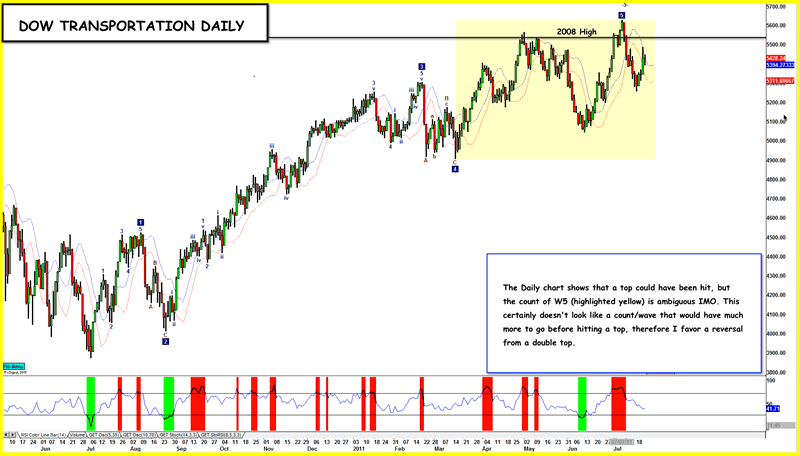
Let's look at the Transportation Average Daily chart and see if that gives us any clues about the near-term action we might expect based on Elliott Waves. I've highlighted in yellow what GET is calling W5 of this final impulsive push up to the old high. GET isn't making much sense out of the count on the Daily chart, and I think I can see a better count.
When you are using oscillators to determine when a wave is complete, the interval you use is important. The Daily chart above is crying for a more compressed chart and the Weekly is the next compression we can use. We saw the Weekly chart above and the count for this last leg up was not very helpful because the software was focusing on the whole rally from Mar2009. In order to analyze this final impulsive move from July of last year, I localized the Elliott Count on the Weekly chart and the chart below is the result. This gives us an interesting count that I like, and it helps us with the possible short-term direction for the market. Since most of us here are day-traders, the short-term is the most important timeframe to have correct. Bottom line for this chart is that I think the Bears will take control for the short-term before making a new high.
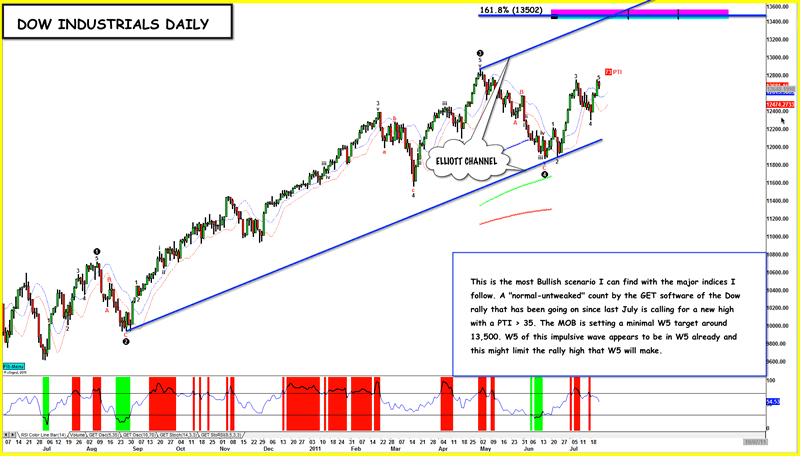
That's about all I can squeeze out of the Transportation Average so lets's take a look at the Dow Industrials. This adds another twist to our analysis. Somehow, the market eventually works out the kinks in ways that we could never have imagined. This is the Daily Chart of the rally from July 2010. I added an Elliott Channel to this chart and the expectation is that W5 will terminate at the upper trendline. However, when you look at the current structure of W5, you will see that it looks like a nice little impulsive wave that is underway. But it doesn't look like an impulsive wave that typically will carry to the 13502'ish level that the bigger count seems to calling for. I have to be on the lookout for a failed or truncated W5 with the Dow.
Based on these studies, I will be looking early next week for market weakness. I won't fight the Bulls if they come to the party in strength though. When I have more data to swing my opinion in one direction or the other, I'll let y'all know. Until then, good luck in your trading! Remember my motto ~ ALWAYS ORIGINAL, SOMETIMES RIGHT!
If you like what you see here, wait to see how MortiES's analysis can assist you in your everyday investing or trading strategy! Go ahead, check out my track record and Click on "Subscribe to MortiES Premium" and give it a try! I am offering a 30 day free trial period.
Dr. John Trapp a.k.a. Mortie for Value of Perfect Information who offer stock market commentary, fundamental & technical analyses on the financial markets. Try MortiES' 30 day free trial.
© 2011 Copyright Dr. John Trapp - All Rights Reserved Disclaimer: The above is a matter of opinion provided for general information purposes only and is not intended as investment advice. Information and analysis above are derived from sources and utilising methods believed to be reliable, but we cannot accept responsibility for any losses you may incur as a result of this analysis. Individuals should consult with their personal financial advisors.
© 2005-2022 http://www.MarketOracle.co.uk - The Market Oracle is a FREE Daily Financial Markets Analysis & Forecasting online publication.