


Stock Market Update: Trading By the Book
Stock-Markets / US Stock Markets Dec 02, 2007 - 08:21 AM GMTBy: Dominick
 It's not easy trading against the crowd. It's tough to get long and put real money on the line when everywhere you go you hear about the market crashing, about a looming 3 rd wave down, about breakdowns, write downs, and basically the end of the bull market. But buy in the face of all that bearishness is exactly what we did at TTC for no other reason than that we tune out the rest and simply trade the charts.
This week unfolded in a textbook five-wave impulse that it's frankly stupefying that no one else saw happening. Now, the market's just missed our upper target for this move by a mere 75 cents, unless it's going back there on Monday to finish the job and, of course, everyone's bullish. You might remember back to November 11 when I wrote, “ Now, just as some big names are calling this the end of the bull market we're willing to go it alone and say this is probably closer to the end of the selling than the beginning, and, if that assessment is correct, we'll be seeing the market turn soon and rally hard, quite likely taking us to new highs .”
Or perhaps you read the November 19 update, which said, “ going into the holiday week and the year end in general we're expecting more potential upside .”
Now, in hindsight, everyone sees how we came out of the leading diagonal at Tuesday's lows this week, never mind that week after week as the trading got choppier and choppier analysts were taking the top practically for granted. Never mind how everyone's focus on the internet was at 1360 and the trapdoor there waiting to open and swallow the market whole. Nevermind that going into the lows there was simply too much risk premium in the market and that if you ignored all the chatter, the charts themselves were suggesting the possibility of an explosive rally.
But all along I refused letting go of the possibility the selling from the recent high was corrective simply because the charts had not ruled out the possibility. The fact that by early this week we'd reached our target for the lows made it a bit easier to be bold and post the following chart:
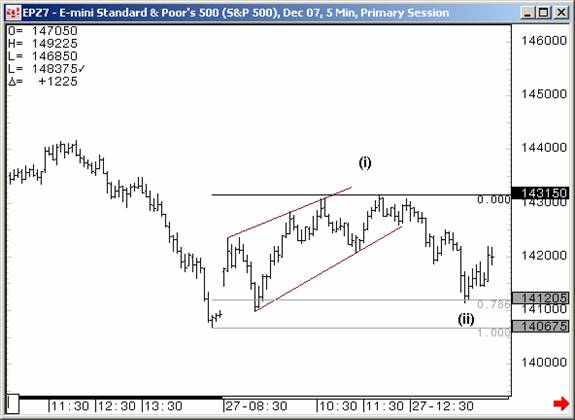
With everyone whipped up into a bearish frenzy, this looked to be a classic bear flag pattern, and no doubt plenty of traders sold it that way. For us, though, it was a warning, the market's whispered suggestion of a bullish setup. Sure, there was no way to know at the time exactly which way it would turn, but with one of our proprietary indicators showing support and screaming buy, it was not something to ignore.
The combination of pattern recognition and indicators was enough to have me buying OTM calls on the cheap. Some bought alongside me, others laughed. As you well know, Wednesday opened with a huge gap that continued into a record-breaking monster of a rally that made our leading diagonal above the Chart of the Week, hands down, the whipsaw, textbook Wall Street modus operandi.
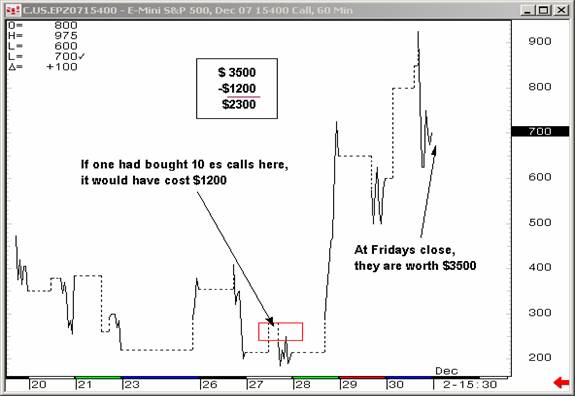
Below is also a chart of what the calls that I bought did. Anyone buying the way out of the money calls would have laid out $1200 to see their position be worth $3500 at Fridays close. They reached almost $10 on the intraday.
If you're a regular reader then you know we have proprietary numbers we use a potential targets and pivots to navigate volatile markets when Elliott wave alone won't cut it. Our numbers were the same this week as last – we closely watched the market's reaction to 1437. Going through would get us to 1457.50, and moving through that level would confirm the bottom was in place.
But unlike recent weeks, this was not a week where Elliott wave alone was insufficient to successfully trade the ups and downs of the markets. In fact, this week was textbook Elliott! Of course, that makes it all the more curious why so few saw it coming, but the point is that it's rather humorous to hear the media's speculations about what's causing these gaps and rallies when Elliott wave by itself predicted every move!
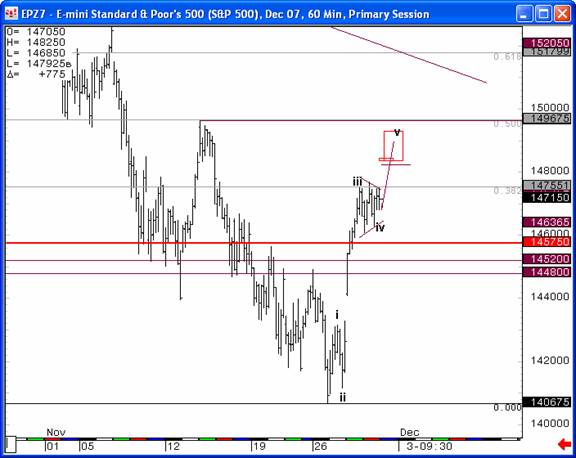
The chart above clearly shows the leading diagonal up, followed by a deep wave 2 retrace which gave way to a powerful vault upwards in a wave 3 that stretched to 2.618 times wave 1. After that we consolidated in a contracting triangle wave 4, which by all expectations should end with a thrust upwards. Whether it was Bernanke, or any other reason you might want to come up with, the market gapped up 20 points Friday morning to deliver the perfect completion of the Elliott pattern. As you can tell from the chart, we fully expected Fridays mornings move.
Believe me, it's not always this easy, but this time it was, as too many professional analysts and traders out there are regretfully learning after the fact. I know Thanksgiving is over, but it was a week to be grateful for a community of unbiased traders. The team really pulled together this week finding and sharing charts that kept us on the right side of the trade while so many others were obviously getting squeezed. What must look like a random market to so many retail and institutional traders is clearly marked on the road map for those who know how to read and trade the charts. With a whole community of these traders driving our forums and chatroom, TTC takes the random out of the market!
You were promised a Santa Claus rally by this update and now you've gotten it. The week played out by the book and lots of our members made serious money. The completion of the pattern is not confirmed, but can't be far off, which means we can expect the huge gains of this week to tail off in the days ahead as the market digests these huge moves. Just as the bears had pushed too hard by the start of this week, we'll probably see the bulls go too far, if they haven't already. But that doesn't mean we're getting bearish! In fact, this year, the Santa Claus rally looks like it might extend a few months into next year. I hope you'll join TTC and see!
Finally, if you haven't yet heard the news, a fee increase is on the horizon for TTC and there's the strong likelihood that we'll be closing our doors to new retail members in 2008. That means the clock is ticking on any readers who are thinking about joining, but have yet to act. For more information about these coming changes, click here . It's also not too late to participate in our annual Pick the Tick contest where you could win a 5-oz fine silver round with our own TTC design, courtesy of the Northwest Territorial Mint. For more details on the contest, click here .
Have a profitable and safe week trading, and remember:
“Unbiased Elliott Wave works!”
By Dominick
www.tradingthecharts.com
If you've enjoyed this article, signup for Market Updates , our monthly newsletter, and, for more immediate analysis and market reaction, view my work and the charts exchanged between our seasoned traders in TradingtheCharts forum . Continued success has inspired expansion of the “open access to non subscribers” forums, and our Market Advisory members and I have agreed to post our work in these forums periodically. Explore services from Wall Street's best, including Jim Curry, Tim Ords, Glen Neely, Richard Rhodes, Andre Gratian, Bob Carver, Eric Hadik, Chartsedge, Elliott today, Stock Barometer, Harry Boxer, Mike Paulenoff and others. Try them all, subscribe to the ones that suit your style, and accelerate your trading profits! These forums are on the top of the homepage at Trading the Charts. Market analysts are always welcome to contribute to the Forum or newsletter. Email me @ Dominick@tradingthecharts.com if you have any interest.
This update is provided as general information and is not an investment recommendation. TTC accepts no liability whatsoever for any losses resulting from action taken based on the contents of its charts, commentaries, or price data. Securities and commodities markets involve inherent risk and not all positions are suitable for each individual. Check with your licensed financial advisor or broker prior to taking any action.
Dominick Archive |
© 2005-2022 http://www.MarketOracle.co.uk - The Market Oracle is a FREE Daily Financial Markets Analysis & Forecasting online publication.